Seismic vibrations of the heart

You should be able to see three heartbeats on the bottom line (labled Z), though the Z obscures part of one of the waves.

We were working on plate tectonics last week, and the conversation went from earthquakes to heartbeats.

I think it started with the question of, “How do we know what the inside of the Earth is like if no one’s been down to see it?”

I agreed that we’ve not even been down to the bottom of the crust because the heat and pressure would collapse any hole we tried to drill. I did not mention that terrible movie, “The Core”, because beyond maybe the first ten minutes where there is some actual speculative science fiction, it’s really not worth seeing.

But beneath the crust, how do we know how thick the mantle is? How do we know that the inner core is solid metal (mostly iron) while the outer core is liquid metal?

Not wanting to go into too much detail I tried to explain about seismic waves. Different types can go through different materials and if you monitor their reflections off different parts of the Earth’s interior you can puzzle out the layering and composition. I just gave the simplest demonstration: if you tap a piece of wood with you knuckle, could you tell that it was wood and not metal? What if you tapped a bucket, could you tell if it was full of water or not? Well seismic tomography work in much the same way, except that you’re usually picking up the reverberations from the earthquake rather than making it yourself by hitting the bucket. There’s also a bit more math involved.

But tapping the bucket gives a quick easy feel (pun intended) for the process. My students at least seemed satisfied.

So then I pointed out that you could use an app called iSeismo, to detect seismic waves. Both the iPhone (and its variants) and the iPad have accelerometers that can be used to pick up motion in all three dimensions. My students from last year remembered it, and at least one already had it loaded on his phone.

A quick test showed that the phone’s pretty sensitive. You can pick up two people jumping together all the way across the room. This part of the demo is nice because it helps prove that seismic waves from earthquakes can go very far. You can also see the little squiggles as the waves are picked up.

I did not try it this time, and I’ll need to confirm if it will work, but since the time on the phones should be well synchronized over the network, and iSeismo can output the actual data, we should be able to use three iPhones to triangulate the location of the jumpers. This might work in nicely with geometry now that I think about it.

Checking for a heartbeat using iSeismo.

Anyway, finally, a student asked if the phone might be able to pick up his heartbeat if he lay on his back.

We tried it. Lying on his back on the floor while holding his breath, we could see his heartbeat quite clearly.
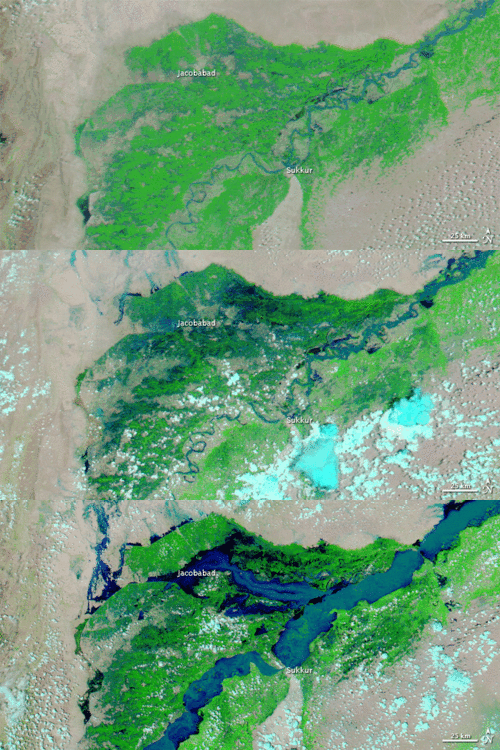
Flooding in Pakistan

Satellite images of flooding in Pakistan. (Images from NASA's Earth Observatory)

One of the largest natural disasters in history, the change in the landscape from the Pakistani flooding is astounding when viewed from space.

Images are from the area around Jacobabad in Pakistan.

[googleMap name=”Pakistani Sindh” description=”Flooding” width=”450″ height=”400″ mapzoom=”6″ mousewheel=”false” directions_to=”false”]Jacobabad[/googleMap]

Jam tectonics

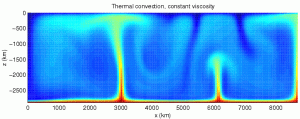
Boiling jam will often create a froth that floats on top, much like the granitic continental crust floats on the Earth’s mantle. Also like the boiling jam, the mantle convects (even though the mantle is not liquid).

Convection in jam.

The darker red areas in the image are where the convection cells in the boiling jam reach the surface and push the froth away. It’s a bit like the bulge in the Earth’s crust that occurs beneath hot-spots and the mid-ocean ridges.

Model of convection in the Earth's mantle (image from Wikipedia)

Oil does not come from dinosaurs.

Phytoplankton (image from NASA).

There’s a nice article in the New York Times on the fact that oil, petroleum, did not come form dead dinosaurs, but rather from the microscopic plankton that died and fell to the ocean floor.

The idea that oil came from the terrible lizards that children love to learn about endured for many decades. The Sinclair Oil Company featured a dinosaur in its logo and in its advertisements, and outfitted its gas stations with giant replicas that bore long necks and tails. The publicity gave the term “fossil fuels” new resonance. – Broad, 2010

It’s easy to forget how pervasive is the idea that oil comes from dinosaurs. Broad’s article is a nice reminder that:

Today, a principal tenet of geology is that a vast majority of the world’s oil arose not from lumbering beasts on land but tiny organisms at sea. It holds that blizzards of microscopic life fell into the sunless depths over the ages, producing thick sediments that the planet’s inner heat eventually cooked into oil. It is estimated that 95 percent or more of global oil traces its genesis to the sea. – Broad, 2010

How do we know?

[I]n the 1930s. Alfred E. Treibs, a German chemist, discovered that oil harbored the fossil remains of chlorophyll, the compound in plants that helps convert sunlight into chemical energy. The source appeared to be the tiny plants of ancient seas. – Broad, 2010

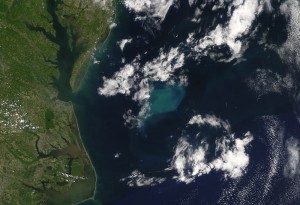
Phytoplankton bloom off the Carolina coast. (Image from NASA).

We tend to find a lot of oil in the deltas of the great rivers because the rivers provide nutrients for the microorganisms to survive and layers of sand and clay sediments that trap the oil and natural when they’re produced.

The article also ties the location of oil production to the geography of plate tectonics.

[W]hen Africa and South America slowly pulled apart in the Cretaceous period, forming the narrow beginnings of the South Atlantic. Big rivers poured in nutrients. A biological frenzy on the western shores of the narrow ocean ended up forming the vast oil fields now being discovered and developed off Brazil in deep water. – Broad, 2010

Sinkholes

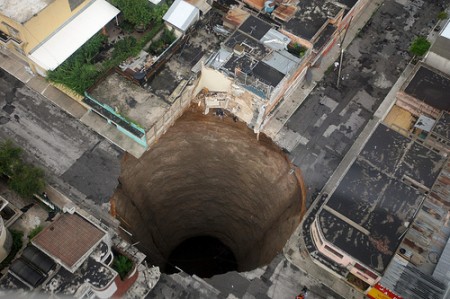
Image from Gobierno de Guatemala.

The caves at Meramec were created in dissolved carbonate rocks; that’s how most caves with interesting cave formation form. The recent storms in Guatemala, along with leaky sewage pipes, have helped speed the dissolution process producing some devastating sinkholes.

[googleMap name=”Guatemala City” description=”Guatemala City” width=”450″ height=”400″ mapzoom=”4″ mousewheel=”false”]Guatemala City[/googleMap]

Spelunking at Meramec

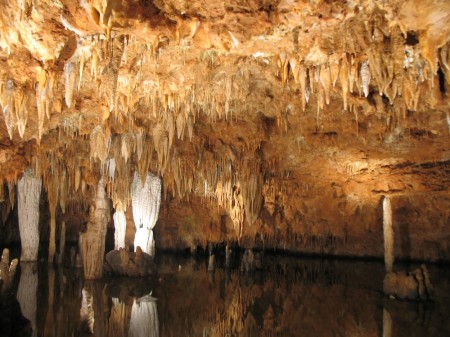
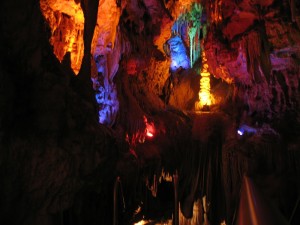
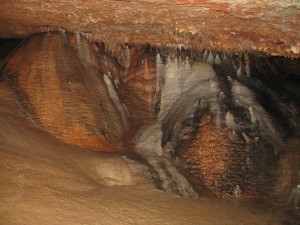
Stalactites dripping down into a subterranean pool at Meramec Caverns.

On the last day of our trip we drove an hour west of St. Louis to Meramec Caverns. If you’re ever on I44 heading out of St. Louis you can’t miss it. From 30 km away you start seeing billboards, sometimes in pairs, almost every 100 meters.

Largely this is because it is a privately owned cave. Privately owned also means that they can do things to “enhance” the cave that you would not see at a National Park like Mammoth Cave. The light shows in certain caves were particularly interesting. Our tour guide was pretty good, entertaining and scientifically accurate for a general audience.

Colors created by different metal anion precipitates.

The presence of different colors in the rock formations (red, white and black) due to different metals in the carbonate precipitates could tie in very well with our discussion earlier this year of ionic bonding.

There are also historical tie-ins. The cave was the site of a skirmish during the civil war, because the bat guano was being used to produce gunpowder. Jesse James participated in that engagement and later used the cave as a hideout.

Still

Finally, they have a reconstructed hut, which although it has nothing to do with the cave, has a bootlegger’s still does link with our discussion of steam distillation.

Oil slick

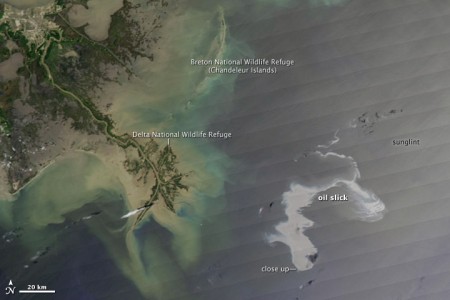
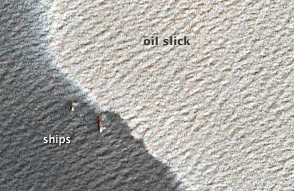
Oil slick in the Gulf of Mexico on April 25th, 2010. Image from NASA.

The scale of the disaster caused by the oil leaking into the Gulf of Mexico from the damaged oil rig is increasing day by day. We are preparing to go on the end-of-year adventure trip soon, but I’m wondering if students might be interested in heading down to the Gulf coast to volunteer in the clean-up.

Scale of the slick. Image from NASA (April 25th).

NASA’s Earth Observatory has some amazing imagery on its page on the oil leak. Many of the images also show the mouth of the Mississippi and its delta, which tie directly into our observations in the sandbox. The impact of the oil spill also brings up the topic of density differences in fluids, something we’ve seen in the making bread jars, but applied to a much larger scale.

Integrating Eyjafjallajökull

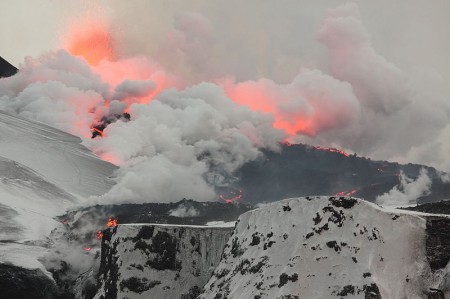
Second fissure, viewed from the north, on 2 April 2010 (from Wikipedia)

Current events often generate the teachable moments we’re always seeking in order to strike students’ imagination. The eruption of Eyjafjallajökull is a prime example. I’ve already used it to point out the intersection of geothermal energy and plate tectonics, but there is so much more.

The second eruption in Eyjafjallajökull. Seen from Fljótshlíð on 20 April 2010 (from Wikipedia).

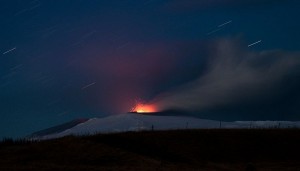
Eyjafjallajökull has been a wonderful subject for the art of photography. The image above is a great example but the time-lapse photos have been excellent. The photo to the right captures not just the stars streaking across the sky with a three minute exposure but the fiery red arcs of the volcanic ejecta.

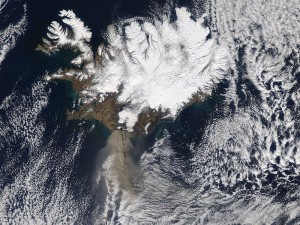
The MODIS instrument on NASA's Aqua satellite captured an ash plume from Eyjafjallajökull Volcano over the North Atlantic at 13:20 UTC on 17 April 2010 (from NASA via Wikipedia).

One of the major benefits of the space program so far has been its Earth observing satellites. There is so much going on in the image to the left that it’s hard to know where to start. Why are there all those clouds over Iceland? (warmer land mass creates convection); what’s with the two plumes from the volcano, one concentrated high level and one disperse low level plume; fjords on the upwind side of the island and the straightened coastline on the lee; greenish plumes of glacier-ground, rock flour discharging into the ocean.

Dust particles suspended in the atmosphere scatter light from the setting sun, generating 'volcanic lavenders' like this one over the flight path of Leeds-Bradford Airport in England during the aviation shutdown. (from Wikipedia).

The dinosaurs were done in either by an asteroid impact in the Yucatan or the eruption of the massive flood volcanoes in Deccan, India, or quite probably both. Both of these events launched an enormous amount of ash, gas and fine particles into the upper atmosphere, blocking sunlight, causing global cooling. Well the ash from Eyjafjallajökull and the sulfur dioxide gas may be having a similar effect on Europe, and if there’s enough of it, on the world. The 1992 eruption of Mt. Pinatubo cooled the globe by about half a degree Celsius.