Practicing Plotting Points on the Co-ordinate Plain

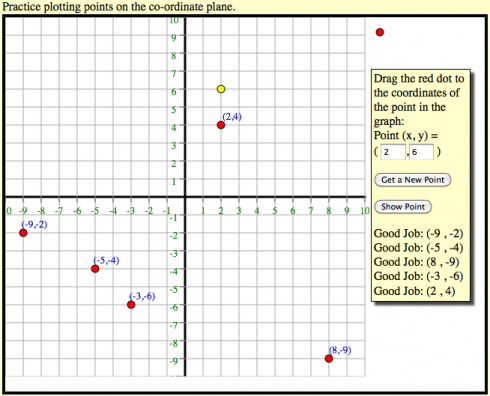
Pre-Algebra class starts next week, so in preparation for one of the early lessons on how to plot x,y co-ordinates, I put together an interactive plotter that lets students drag points onto the co-ordinate plain.

Students practice plotting points by dragging the red dot to the coordinates given.

Usage

The program generates random coordinate pairs within the area of the chart (or you can enter values of the coordinates yourself):

  • Clicking the “Show Point” button will place a yellow dot at the point.
  • When you’re confident you understand how the coordinate pairs work, you can practice by dragging the red dot to where you think the point is and the program will tell you if you’re right or not.

About the Program

This interactive application uses the jQuery and KineticJS javascript libraries. The latter library in particular is useful for making the HTML5 canvases interactive, so you can click on points on the graph and drag them.

When I have some time, after classes settle down, I’ll see if I can figure out how to embed this type of app into this (WordPress) blog. KineticJS is based off HTML5 canvases, which is what I use for the other interactive graphs I’ve posted, so it shouldn’t be terribly hard (at least in principle).

The Algebra of Straight Lines

A quick graphical calculator for straight lines — based on This. It’s still incomplete, but it’s functional, and a useful complement to the equation of a straight line animation and the parabola graphing.

You can graph lines based on the equation of a line (in either the slope-intercept or point-slope forms), or from two points.

[inline]

Straight Lines


Slope-Intercept Form Two Points Point-Slope Form

y = m x + b

(x1, y1) =
( ,
)

y – y1 = m ( x – x1)
y =
x +


(x2, y2) =
( ,
)
y –
=
( x –
)

x intercept:

Slope:

Equation:
y intercept:

Points:


Your browser does not support the canvas element.

[script type=”text/javascript”]

var width=500;
var height=500;
var xrange=10;
var yrange=10;

mx = width/(2.0*xrange);
bx = width/2.0;
my = -height/(2.0*yrange);
by = height/2.0;

document.getElementById(‘testing’).innerHTML = “Hello2”;

function draw_9359(ctx, polys) {

t_9359=t_9359+dt_9359;
//ctx.fillText (“t=”+t, xp(5), yp(5));
ctx.clearRect(0,0,width,height);

polys[0].drawAxes(ctx);
ctx.lineWidth=2;
polys[0].draw(ctx);

polys[0].write_eqn2(ctx);

//ctx.fillText (polys[0].get_parabola_vertex_form_eqn(), xp(5), yp(-5) );

// SHOW 2 POINTS USED TO CALCULATE LINE
if (show_2pts_ctrl_9359.checked==true) {
polys[0].circle_point(ctx, polys[0].p1.x, polys[0].p1.y, “#000”, 0.15);
polys[0].label_point_on_line(ctx, polys[0].p1.x, polys[0].p1.y);
polys[0].circle_point(ctx, polys[0].p2.x, polys[0].p2.y, “#000”, 0.15);
polys[0].label_point_on_line(ctx, polys[0].p2.x, polys[0].p2.y);

}

// SHOW Y INTERCEPT
if (show_y_intercept_ctrl_9359.checked==true) {
polys[0].draw_y_intercept_line(ctx);
document.getElementById(‘y_intercept_pos_9359’).innerHTML = “( 0 , “+ polys_9359[0].c.toPrecision(2)+ ” )”;

if (polys[0].b > 0.0) {
ctx.textAlign=”right”;
xoff = -0.5;
}
else {
ctx.textAlign=”left”;
xoff = 0.5;
}
ctx.fillText (‘y intercept: y = ‘+polys[0].c.toPrecision(2), xp(xoff), yp(polys_9359[0].c+0.25));

} else { document.getElementById(‘y_intercept_pos_9359’).innerHTML = “”;}

// SHOW SLOPE
if (show_slope_ctrl_9359.checked==true) {
polys[0].draw_slope_line(ctx);
document.getElementById(‘slope_pos_9359’).innerHTML = ” = “+polys[0].b.toPrecision(2);

} else { document.getElementById(‘slope_pos_9359’).innerHTML = “”;}

document.getElementById(‘slope_int_equation_9359’).innerHTML = polys[0].get_eqn2();

//SHOW INTERCEPTS
ctx.textAlign=”center”;
if (show_intercepts_ctrl_9359.checked==true) {
polys[0].x_intercepts(ctx);
if (polys[0].order == 2) {
if (polys[0].x_intcpts.length > 0) {
line = “0 = “;
for (var i=0; i 0.0) { sign=”-“;} else {sign=”+”;}
line = line + “(x “+sign+” “+ Math.abs(polys[0].x_intcpts[i].toPrecision(2))+ “)”;
}
ctx.fillText (line, xp(6), yp(7));
for (var i=0; i 0) {
if (polys[0].b > 0.0) {
ctx.textAlign=”right”;
xoff = -0.5;
}
else {
ctx.textAlign=”left”;
xoff = 0.5;
}
ctx.font = “12pt Calibri”;
ctx.fillStyle = “#00f”;
ctx.fillText (‘x intercept: x = ‘+polys[0].x_intcpts[0].toPrecision(2), xp(polys[0].x_intcpts[0]+xoff), yp(0.5));
document.getElementById(‘intercepts_pos_9359’).innerHTML = “( “+ polys[0].x_intcpts[0].toPrecision(2) + “, 0 )”;
}
else {
ctx.fillText (‘None’, xp(7), yp(7));
}

}

}
else {
document.getElementById(‘intercepts_pos_9359’).innerHTML = ” “;
}

// Finding the slope
outln = “

Finding the Slope

“;
outln += “

The slope of the line between the two points is the rise divided by the run: the change in elevation divided by the horizontal distance between the points.”;

// Write out intercept solution
outln = “

Finding the x-intercept

“;
outln += “

Start with the slope-intercept form of the equation:”;
outln += “

     “+polys[0].get_eqn2(“y”,”x”,”html”)+”“;
outln += “

Know that at the x-intercept, y = 0 , which you substitute into the equation to get:”;
outln += “

     “+polys[0].get_eqn2(“0″,”x”,”html”)+”“;
outln += “

Now move the b coefficient to the other side of the equation:”;
outln += “

     “+(-polys[0].c).toPrecision(2)+” = “+ polys[0].b.toPrecision(2)+”x”+”“;
outln += “

And divide both sides by the slope to solve for x:”;
outln += “

     “+(-polys[0].c).toPrecision(2)+ ” / “+ polys[0].b.toPrecision(2) + ” = “+ polys[0].b.toPrecision(2)+”x”+ ” / “+ polys[0].b.toPrecision(2)+”“;
outln += “

     “+(-polys[0].c/polys[0].b).toPrecision(2)+” = “+”x”+”“;
outln += “

Therefore, the line intercepts the x axis at the point:”;
outln += “

     ( “+(-polys[0].c/polys[0].b).toPrecision(2)+” , 0 )”;
outln += “

When,”;
outln += “

     “+”x = “+ (-polys[0].c/polys[0].b).toPrecision(2) +”“;

document.getElementById(‘x_intercept_9359’).innerHTML = outln;

//Write out the solution by factoring
solution = “

Finding the y-intercept

“;
if (polys[0].order == 2) {
solution = solution + “y = “+polys[0].a.toPrecision(2)+” x2 “+polys[0].bsign+” “+Math.abs(polys[0].b.toPrecision(2))+” x “+ polys[0].csign+” “+Math.abs(polys[0].c.toPrecision(2))+”

“;

solution = solution + ‘Factoring:      ‘;

if (polys[0].x_intcpts.length > 0) {
solution = solution + ‘0 = ‘;
for (var i=0; i 0.0) { sign=”-“;} else {sign=”+”;}
solution = solution + “(x “+sign+” “+ Math.abs(polys[0].x_intcpts[i].toPrecision(2))+ “)”;
}
solution = solution + ‘

‘;
solution = solution + ‘Set each factor equal to zero:
     ‘;
for (var i=0; i 0.0) { sign=”-“;} else {sign=”+”;}
solution = solution + “x “+sign+” “+ Math.abs(polys[0].x_intcpts[i].toPrecision(2))+ ” = 0           “;
}
solution = solution + ‘

and solve for x:
     ‘;
for (var i=0; i‘;
}
document.getElementById(‘equation_9359’).innerHTML = solution;
}

else if (polys[0].order == 1) {
solution = solution + ‘

At the y-axis x = 0.
To find the y intercept, take the equation of the line, set x = 0, and solve for x.’;
solution = solution + ‘

     ‘;
solution = solution + “y = “+” “+Math.abs(polys[0].b.toPrecision(2))+” x “+ polys[0].csign+” “+Math.abs(polys[0].c.toPrecision(2))+”

“;
solution = solution + ‘     ‘;
solution = solution + ” 0 = “+” “+Math.abs(polys[0].b.toPrecision(2))+” x “+ polys[0].csign+” “+Math.abs(polys[0].c.toPrecision(2))+”

“;
solution = solution + ‘     ‘;
solution = solution + (-1.0*polys[0].c).toPrecision(2) +” = “+” “+Math.abs(polys[0].b.toPrecision(2))+” x “+”

“;
solution = solution + ‘     ‘;
solution = solution + (-1.0*polys[0].c).toPrecision(2)+”/”+polys[0].b.toPrecision(2)+” = “+” x “+”

“;
solution = solution + ‘     ‘;
solution = solution + “x = “+ (-1.0*polys[0].c/polys[0].b).toPrecision(4)+”

“;

document.getElementById(‘equation_9359’).innerHTML = solution;

}

}

function update_form_9359 () {
b_coeff_9359.value = polys_9359[0].b+””;
c_coeff_9359.value = polys_9359[0].c+””;

y1_coeff_9359.value = polys_9359[0].y1+””;
b1_coeff_9359.value = polys_9359[0].b+””;
x1_coeff_9359.value = polys_9359[0].x1+””;

p1_x_9359.value = polys_9359[0].p1.x+””;
p1_y_9359.value = polys_9359[0].p1.y+””;
p2_x_9359.value = polys_9359[0].p2.x+””;
p2_y_9359.value = polys_9359[0].p2.y+””;
}

//init_mouse();

var c_9359=document.getElementById(“myCanvas_9359”);
var ctx_9359=c_9359.getContext(“2d”);

var change = 0.0001;

function create_lines_9359 () {
//draw line
//document.write(“hello world! “);
var polys = [];
polys.push(addPoly(0,2, 3));
document.getElementById(‘testing’).innerHTML = “Hello”;
polys[0].set_2_points_line();
document.getElementById(‘testing’).innerHTML = “Hello4″;

// polys[1].color = ‘#8C8’;

return polys;
}

var polys_9359 = create_lines_9359();

var x1=xp(-10);
var y1=yp(1);
var x2=xp(10);
var y2=yp(1);
var dc_9359=0.05;

var t_9359 = 0;
var dt_9359 = 100;
//end_ct = 0;
var st_pt_x_9359 = 2;
var st_pt_y_9359 = 1;
var show_y_intercept_9359 = 1; //1 to show y intercept on startup
var show_intercepts_9359 = 0; // 1 to show the intercepts
var show_slope_9359 = 0; // 1 to show the slope
var show_2pts_9359 = 0; // 1 to show the two points from which line can be calculated

var move_dir_9359 = 1.0; // 1 for up

//document.getElementById(‘comment_spot’).innerHTML = polys_9359[0].a+” “+polys_9359[0].b+” “+polys_9359[0].c+” : “+polys_9359[0].h+” “+polys_9359[0].k+” “;

document.getElementById(‘testing’).innerHTML = “Hello3”;

//slope-intercept form
var b_coeff_9359 = document.getElementById(“b_coeff_9359”);
var c_coeff_9359 = document.getElementById(“c_coeff_9359”);

//point-slope form
var y1_coeff_9359 = document.getElementById(“y1_coeff_9359”);
var b1_coeff_9359 = document.getElementById(“b1_coeff_9359”);
var x1_coeff_9359 = document.getElementById(“x1_coeff_9359”);

//equation from two points
var p1_x_9359 = document.getElementById(“x1_9359”);
var p1_y_9359 = document.getElementById(“y1_9359”);
var p2_x_9359 = document.getElementById(“x2_9359”);
var p2_y_9359 = document.getElementById(“y2_9359”);

//options
var show_y_intercept_ctrl_9359 = document.getElementById(“show_y_intercept_9359”);
if (show_y_intercept_9359 == 0) {show_y_intercept_ctrl_9359.checked=false;
} else {show_y_intercept_ctrl_9359.checked=true;}

var show_intercepts_ctrl_9359 = document.getElementById(“show_intercepts_9359”);
if (show_intercepts_9359 == 0) {show_intercepts_ctrl_9359.checked=false;
} else {show_intercepts_ctrl_9359.checked=true;}

var show_slope_ctrl_9359 = document.getElementById(“show_slope_9359”);
if (show_slope_9359 == 0) {show_slope_ctrl_9359.checked=false;
} else {show_slope_ctrl_9359.checked=true;}

var show_2pts_ctrl_9359 = document.getElementById(“show_pts_9359”);
if (show_2pts_9359 == 0) {show_2pts_ctrl_9359.checked=false;
} else {show_2pts_ctrl_9359.checked=true;}

update_form_9359();

//document.write(“test= “+c_coeff_9359.value+” “+polys_9359[0].c);
setInterval(“draw_9359(ctx_9359, polys_9359)”, dt_9359);

b_coeff_9359.onchange = function() {
polys_9359[0].set_b(parseFloat(this.value));
polys_9359[0].update_point_slope_form_line();
polys_9359[0].set_2_points_line();
update_form_9359();
}
c_coeff_9359.onchange = function() {
//polys_9359[0].c = parseFloat(this.value);
polys_9359[0].set_c(parseFloat(this.value));
polys_9359[0].update_point_slope_form_line();
polys_9359[0].set_2_points_line();
update_form_9359();
}

y1_coeff_9359.onchange = function() {
//polys_9359[0].a = parseFloat(this.value);
polys_9359[0].y1 = parseFloat(this.value);
polys_9359[0].update_slope_intercept_form_line();
polys_9359[0].set_2_points_line();
update_form_9359();
}

b1_coeff_9359.onchange = function() {
polys_9359[0].set_b(parseFloat(this.value));
polys_9359[0].update_slope_intercept_form_line();
polys_9359[0].set_2_points_line();
update_form_9359();
}

x1_coeff_9359.onchange = function() {
polys_9359[0].x1 = parseFloat(this.value);
polys_9359[0].update_slope_intercept_form_line();
polys_9359[0].set_2_points_line();
polys_9359[0].set_order()
update_form_9359();
}

p1_x_9359.onchange = function() {
polys_9359[0].p1.x = parseFloat(this.value);
polys_9359[0].update_line_from_2pts();
polys_9359[0].set_order()
update_form_9359();
}

p2_x_9359.onchange = function() {
polys_9359[0].p2.x = parseFloat(this.value);
polys_9359[0].update_line_from_2pts();
polys_9359[0].set_order()
update_form_9359();
}

p1_y_9359.onchange = function() {
polys_9359[0].p1.y = parseFloat(this.value);
polys_9359[0].update_line_from_2pts();
polys_9359[0].set_order()
update_form_9359();
}

p2_y_9359.onchange = function() {
polys_9359[0].p2.y = parseFloat(this.value);
polys_9359[0].update_line_from_2pts();
polys_9359[0].set_order()
update_form_9359();
}

//draw_9359();
//document.write(“x”+x2+”x”);
//ctx_9359.fillText (“n=”, xp(5), yp(5));

[/script]

[/inline]
Everything You (N)ever Wanted to Know About Parabolas

So that my students could more easily check their answers graphically, I put together a page with a more complete analysis of parabolas (click this link for more details).

[inline]

Analyzing Parabolas


Standard Form Vertex Form

y = a x2 + b x + c

y = a (x – h)2 + k
y =
x2 +
x +

y =
( x –
) 2 +

Intercepts:

Vertex:
Focus:

Directrix:

Axis:


Your browser does not support the canvas element.

Solution by Factoring:

y = x2 x

[script type=”text/javascript”]
var width=500;
var height=500;
var xrange=10;
var yrange=10;

mx = width/(2.0*xrange);
bx = width/2.0;
my = -height/(2.0*yrange);
by = height/2.0;

function draw_9239(ctx, polys) {
t_9239=t_9239+dt_9239;
//ctx.fillText (“t=”+t, xp(5), yp(5));
ctx.clearRect(0,0,width,height);

polys[0].drawAxes(ctx);
ctx.lineWidth=2;
polys[0].draw(ctx);

polys[0].write_eqn2(ctx);

//polys[0].y_intercepts(ctx);
//write intercepts on graph

// SHOW VERTEX
if (show_vertex_ctrl_9239.checked==true) {
polys[0].draw_vertex(ctx);
document.getElementById(‘vertex_pos_9239’).innerHTML = “(“+polys_9239[0].vertex.x.toPrecision(2)+ ” , “+polys_9239[0].vertex.y.toPrecision(2)+ ” )”;
} else { document.getElementById(‘vertex_pos_9239’).innerHTML = “”;}

// SHOW FOCUS
if (show_focus_ctrl_9239.checked==true) {
polys[0].draw_focus(ctx);
document.getElementById(‘focus_pos_9239’).innerHTML = “(“+polys_9239[0].focus.x.toPrecision(2)+ ” , “+polys_9239[0].focus.y.toPrecision(2)+ ” )”;
} else { document.getElementById(‘focus_pos_9239’).innerHTML = “”;}

// SHOW DIRECTRIX
if (show_directrix_ctrl_9239.checked==true) {
polys[0].draw_directrix(ctx);
document.getElementById(‘directrix_pos_9239’).innerHTML = polys[0].directrix.get_eqn2(“y”,”x”,”html”);

polys[0].directrix.write_eqn2(ctx, polys[0].directrix.get_eqn2(“directrix: y”));
} else { document.getElementById(‘directrix_pos_9239’).innerHTML = “”;}

// SHOW AXIS
if (show_axis_ctrl_9239.checked==true) {
polys[0].draw_parabola_axis(ctx);
document.getElementById(‘axis_pos_9239’).innerHTML = “x = “+polys[0].vertex.x.toPrecision(2);
}

//SHOW INTERCEPTS
ctx.textAlign=”center”;
if (show_intercepts_ctrl_9239.checked==true) {
polys[0].x_intercepts(ctx);
ctx.fillText (‘x intercepts: (when y=0)’, xp(6), yp(8));
//ctx.fillText (‘intercepts=’+polys[0].x_intcpts.length, xp(5), yp(-5));
if (polys[0].order == 2) {
if (polys[0].x_intcpts.length > 0) {
line = “0 = “;
for (var i=0; i 0.0) { sign=”-“;} else {sign=”+”;}
line = line + “(x “+sign+” “+ Math.abs(polys[0].x_intcpts[i].toPrecision(2))+ “)”;
}
ctx.fillText (line, xp(6), yp(7));
for (var i=0; i 0) {
for (var i=0; i2 “+polys[0].bsign+” “+Math.abs(polys[0].b.toPrecision(2))+” x “+ polys[0].csign+” “+Math.abs(polys[0].c.toPrecision(2))+”

“;

solution = solution + ‘Factoring:      ‘;

if (polys[0].x_intcpts.length > 0) {
solution = solution + ‘0 = ‘;
for (var i=0; i 0.0) { sign=”-“;} else {sign=”+”;}
solution = solution + “(x “+sign+” “+ Math.abs(polys[0].x_intcpts[i].toPrecision(2))+ “)”;
}
solution = solution + ‘

‘;
solution = solution + ‘Set each factor equal to zero:
     ‘;
for (var i=0; i 0.0) { sign=”-“;} else {sign=”+”;}
solution = solution + “x “+sign+” “+ Math.abs(polys[0].x_intcpts[i].toPrecision(2))+ ” = 0           “;
}
solution = solution + ‘

and solve for x:
     ‘;
for (var i=0; i‘;
}
document.getElementById(‘equation_9239’).innerHTML = solution;
}

else if (polys[0].order == 1) {
solution = solution + ‘
     ‘;
solution = solution + “y = “+” “+Math.abs(polys[0].b.toPrecision(2))+” x “+ polys[0].csign+” “+Math.abs(polys[0].c.toPrecision(2))+”

“;
solution = solution + ‘

Set y=0 and solve for x:
     ‘;
solution = solution + ” 0 = “+” “+Math.abs(polys[0].b.toPrecision(2))+” x “+ polys[0].csign+” “+Math.abs(polys[0].c.toPrecision(2))+”

“;
solution = solution + ‘     ‘;
solution = solution + (-1.0*polys[0].c).toPrecision(2) +” = “+” “+Math.abs(polys[0].b.toPrecision(2))+” x “+”

“;
solution = solution + ‘     ‘;
solution = solution + (-1.0*polys[0].c).toPrecision(2)+”/”+polys[0].b.toPrecision(2)+” = “+” x “+”

“;
solution = solution + ‘     ‘;
solution = solution + “x = “+ (-1.0*polys[0].c/polys[0].b).toPrecision(4)+”

“;

document.getElementById(‘equation_9239’).innerHTML = solution;
}

}

function update_form_9239 () {
a_coeff_9239.value = polys_9239[0].a+””;
b_coeff_9239.value = polys_9239[0].b+””;
c_coeff_9239.value = polys_9239[0].c+””;

av_coeff_9239.value = polys_9239[0].a+””;
hv_coeff_9239.value = polys_9239[0].h+””;
kv_coeff_9239.value = polys_9239[0].k+””;

}

//init_mouse();

var c_9239=document.getElementById(“myCanvas_9239”);
var ctx_9239=c_9239.getContext(“2d”);

var change = 0.0001;

function create_lines_9239 () {
//draw line
//document.write(“hello world! “);
var polys = [];
polys.push(addPoly(1,6, 5));

// polys.push(addPoly(0.25, 1, 0));
// polys[1].color = ‘#8C8’;

return polys;
}

var polys_9239 = create_lines_9239();

var x1=xp(-10);
var y1=yp(1);
var x2=xp(10);
var y2=yp(1);
var dc_9239=0.05;

var t_9239 = 0;
var dt_9239 = 100;
//end_ct = 0;
var st_pt_x_9239 = 2;
var st_pt_y_9239 = 1;
var show_vertex_9239 = 1; //1 to show vertex on startup
var show_focus_9239 = 1; // 1 to show the focus
var show_intercepts_9239 = 1; // 1 to show the intercepts
var show_directrix_9239 = 1; // 1 to show the directrix
var show_axis_9239 = 1; //1 to show the axis of the parabola

var move_dir_9239 = 1.0; // 1 for up

//document.getElementById(‘comment_spot’).innerHTML = polys_9239[0].a+” “+polys_9239[0].b+” “+polys_9239[0].c+” : “+polys_9239[0].h+” “+polys_9239[0].k+” “;

//standard form
var a_coeff_9239 = document.getElementById(“a_coeff_9239”);
var b_coeff_9239 = document.getElementById(“b_coeff_9239”);
var c_coeff_9239 = document.getElementById(“c_coeff_9239”);

//vertex form
var av_coeff_9239 = document.getElementById(“av_coeff_9239”);
var hv_coeff_9239 = document.getElementById(“hv_coeff_9239”);
var kv_coeff_9239 = document.getElementById(“kv_coeff_9239”);

//options
var show_vertex_ctrl_9239 = document.getElementById(“show_vertex_9239”);
if (show_vertex_9239 == 0) {show_vertex_ctrl_9239.checked=false;
} else {show_vertex_ctrl_9239.checked=true;}

var show_focus_ctrl_9239 = document.getElementById(“show_focus_9239”);
if (show_focus_9239 == 0) {show_focus_ctrl_9239.checked=false;
} else {show_focus_ctrl_9239.checked=true;}

var show_intercepts_ctrl_9239 = document.getElementById(“show_intercepts_9239”);
if (show_intercepts_9239 == 0) {show_intercepts_ctrl_9239.checked=false;
} else {show_intercepts_ctrl_9239.checked=true;}

var show_directrix_ctrl_9239 = document.getElementById(“show_directrix_9239”);
if (show_directrix_9239 == 0) {show_directrix_ctrl_9239.checked=false;
} else {show_directrix_ctrl_9239.checked=true;}

var show_axis_ctrl_9239 = document.getElementById(“show_axis_9239”);
if (show_axis_9239 == 0) {show_axis_ctrl_9239.checked=false;
} else {show_axis_ctrl_9239.checked=true;}

update_form_9239();

//document.write(“test= “+c_coeff_9239.value+” “+polys_9239[0].c);
setInterval(“draw_9239(ctx_9239, polys_9239)”, dt_9239);

a_coeff_9239.onchange = function() {
//polys_9239[0].a = parseFloat(this.value);
polys_9239[0].set_a(parseFloat(this.value));
polys_9239[0].update_vertex_form_parabola();
update_form_9239();
}
b_coeff_9239.onchange = function() {
//polys_9239[0].b = parseFloat(this.value);
polys_9239[0].set_b(parseFloat(this.value));
polys_9239[0].update_vertex_form_parabola();
update_form_9239();
}
c_coeff_9239.onchange = function() {
//polys_9239[0].c = parseFloat(this.value);
polys_9239[0].set_c(parseFloat(this.value));
polys_9239[0].update_vertex_form_parabola();
update_form_9239();
}

av_coeff_9239.onchange = function() {
//polys_9239[0].a = parseFloat(this.value);
polys_9239[0].set_a(parseFloat(this.value));
polys_9239[0].update_standard_form_parabola();
update_form_9239();
}

hv_coeff_9239.onchange = function() {
polys_9239[0].h = parseFloat(this.value);
polys_9239[0].update_standard_form_parabola();
polys_9239[0].set_order()
update_form_9239();
}

kv_coeff_9239.onchange = function() {
polys_9239[0].k = parseFloat(this.value);
polys_9239[0].update_standard_form_parabola();
polys_9239[0].set_order()
update_form_9239();
}

//draw_9239();
//document.write(“x”+x2+”x”);
//ctx_9239.fillText (“n=”, xp(5), yp(5));

[/script]

[/inline]

Converting the forms

The key relationships are the ones to convert from the standard form of the parabolic equation:

         y = a x^2 + b x + c (1)

to the vertex form:

         y = a (x - h)^2 + k (2)

If you multiply out the vertex equation form you get:

         y = a x2 – 2ah x + ah2 + k (3)

When you compare this equation to the standard form of the equation (Equation 1), if you look at the coefficients and the constants, you can see that:

To convert from the vertex to the standard form use:

          a = a (4)
          b = -2ah (5)
          c = ah^2 + k (6)

Going the other way,

To convert from the standard to the vertex form of parabolic equations use:

          a = a

(7)
          h = \frac{-b}{2a}

(8)
          k = c - ah^2

(9)

Although it is sometimes convenient to let k not depend on coefficients from its own equation:

          k = c - \frac{b^2}{4a} (10)

The Vertex and the Axis

The nice thing about the vertex form of the equation of the parabola is that if you want the find the coordinates of the vertex of the parabola, they’re right there in the equation.

Specifically, the vertex is located at the point:

          (x_v, y_v) = (h, k) (11)

The axis of the parabola is the vertical line going through the vertex, so:

The equation for the axis of a parabola is:

          x = h (12)

Focus and Directrix

Finally, it’s important to note that the distance (d) from the vertex of the parabola to its focus is given by:

          d = \frac{1}{4a} (13)

Which you can just add d on to the coordinates of the vertex (Equation 11) to get the location of the focus.

          (x_f, y_f) = (x_v, y_v + d)  (14)

The directrix is just the opposite, vertical distance away, so the equation for the directrix is the equation of the horizontal line at:

          y = y_v + d  (15)

References

There are already some excellent parabola references out there including:

How to Make Good/Useful Graphics

Flowing Data has a nice post that gets at how to make good images of data. It’s called, “5 misconceptions about visualization“.

The misconceptions:

  • Visualization is for making data flashy
  • Software does everything
  • The more information on a single graphic, the better
  • Visualization is too biased to be useful
  • [A Visualization] has to be exact

How People Spend Their Day

Flowing Data has an excellent set of interactive graphs showing how Americans spend their day. It’s an interesting look into modern American culture.

Main takeaway: we spend most of our time sleeping, eating, working, and watching television.

— Yau, 2011: How do Americans spend their days?

I particularly like comparing the 15-19 adolescents to adults (more time in education and less time watching television; there’s also a different sleeping pattern).

Interactive graphs of "How Americans Spend Their Day" from Flowing Data.

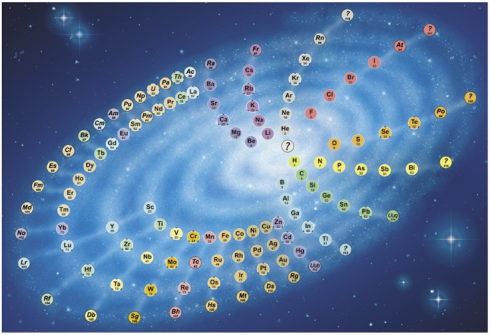
Periodic Table Spiral Galaxy

The objective is to show the shape of the whole and to express the beauty and cosmic reach of the periodic system.

— Stewart (2006): The Chemical Galaxy

Chemical Galaxy II: A new vision of the periodic system of the elements by Philip Stewart.
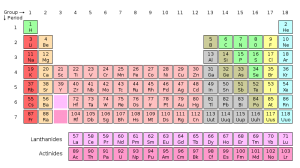
Periodic Table of the Elements - a traditional view by Wikimedia Commons User:Cepheus.

The traditional periodic table of the elements breaks the elements into rows as their chemical and physical characteristics repeat themselves. But since the sequence of elements is really a continuous series that gradually increases in mass, a better way of displaying them might be as the spiral, sort of like the galaxy.

When the chemical elements are arranged in order of their atomic number, they form a continuous sequence, in which certain chemical characteristics come back periodically in a regular way. This is usually shown by chopping the sequence up into sections and arranging them as a rectangular table. The alternative is to wind the sequence round in a spiral. Because the periodic repeats come at longer and longer intervals, increasing numbers of elements have to be fitted on to its coils. …

The resulting pattern resembles a galaxy, and the likeness is the basis of my design. It seems appropriate, as the chemical elements are what galaxies are made of.

The ‘spokes’ of the ‘galaxy’ link together elements with similar chemical characteristics. They are curved in order to keep the inner elements reasonably close together while making room for the extra elements in the outer turns.

— Stewart (2006): The Chemical Galaxy

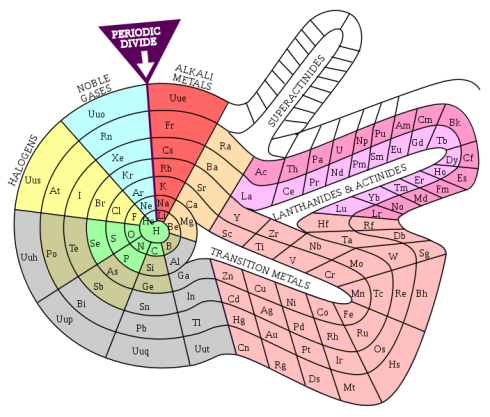
While the spiral version of the periodic table is not used a lot, it is scientifically valid. There are other ways of representing the spiral and the periodic table itself. It all depends on what you want to show.

Benfey's spiral table first appeared in an article by Glenn Seaborg, 'Plutonium: The Ornery Element', Chemistry, June 1964, 37 (6), 12-17, on p. 14. (via Wikimedia Commons)

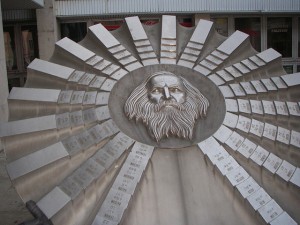
Indeed, Mendeleev’s monument in Bratislava, Slovakia has the elements arranged as the spokes in a wheel.

Monument to the periodic table and Dmitri Mendellev (photo by mmmdirt, caption via Wikipedia).

The Power of Graphs

A couple days ago I had students present their physics lab reports to the class. They did a good job, but I think I need to emphasize the importance of including graphs in their results. It’s much harder to look for trends and patterns in the data without charts, especially when presenting to an audience.

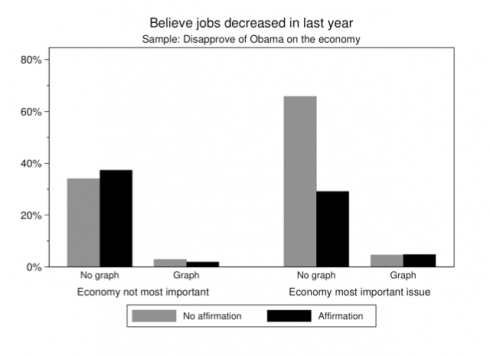
An interesting political science study (via Yglesias) found that it’s much easier to change people’s minds when you show them graphs, even when people don’t want to believe what you’re telling them.

[P]eople cling to false beliefs in part because giving them up would threaten their sense of self. Graphical corrections are … found to successfully reduce incorrect beliefs among potentially resistant subjects and to perform better than an equivalent textual correction.

–Nyhan and Reifler (2011): Opening the Political Mind? The effects of self-affirmation and graphical information on factual misperceptions

Despite the fact that the number of jobs increased in the last year (according to the Bureau of Labor Statistics), many people who disapprove of President Obama believe that the economy lost jobs. A lot of people who were told this with text still believed that there was a net job loss, but when presented with a graph of the actual data the number decreases to close to zero. (Graph from Nyhan and Reifler (2011)

Teachers know how hard it can be to correct misconceptions – people tend to stick with the first thing they learned – so it’s good to see that graphical corrections can make a big difference.

Fortunately, my physics students are changing over to math next week, so we’ll be able to use their experimental data to draw lines, find gradients and do all sorts of interesting things.

Malthusian Growth

I think I may fairly make two postulata.

First, That food is necessary to the existence of man.

Secondly, That the passion between the sexes is necessary and will remain nearly in its present state.

— Malthus (1798): An Essay on the Principle of Population via The Concise Encyclopedia of Economics

“Malthusian” is often used as a derogatory term to refer to alarmist predictions that we’re going to run out of some natural resource. I’m afraid I’ve used the term this way myself, however, according to Lauren Landsburg at the Concise Encyclopedia of Economics, Malthus is being unfairly maligned. He wasn’t actually predicting catastrophe but wondering why the catastrophes don’t usually happen.

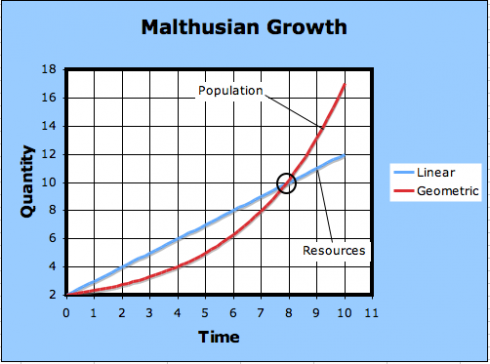
What Thomas Malthus did, in 1798, was point out that while populations grow at a geometric rate – the U.S. population, he noticed, doubled every 25 years – but resources, like food, only increase at an arithmetic rate. As a result, any naturally growing population will eventually run out of resources.

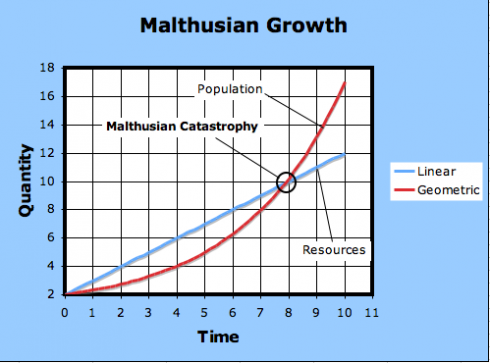
The red line shows geometric growth. No matter how much you start off with, the red line will always end up crossing the blue line.

The linear equation has the form:

 y = m t + b

where y is the quantity produced, t is time (the independent variable), and m and b are constants. This should not look to unfamiliar to students who’ve had algebra.

The geometric equation is a little more complicated:

 y = a^{gt} + c

here a, g and c are constants. g is the most important, because it’s the growth rate – the higher g is the faster the curve will rise. You can play around with the coefficients and graph in this Excel spreadsheet .

At any rate, after the curves intersect, the needs of the population exceeds how much it can produce; this is the point of Malthusian catastrophe.

The intersection point is where the needs of the population exceeds the production.

The observation is, indeed, so stark that it is still easy to lose sight of Malthus’s actual conclusion: that because humans have not all starved, economic choices must be at work, and it is the job of an economist to study those choices.

— Landsburg (2008): Thomas Robert Malthus from The Concise Encyclopedia of Economics.