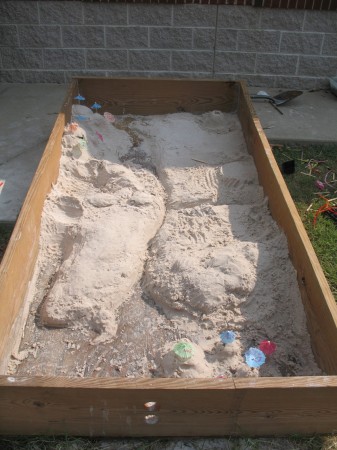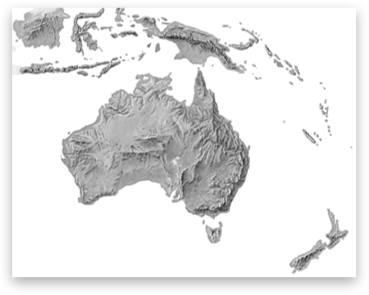
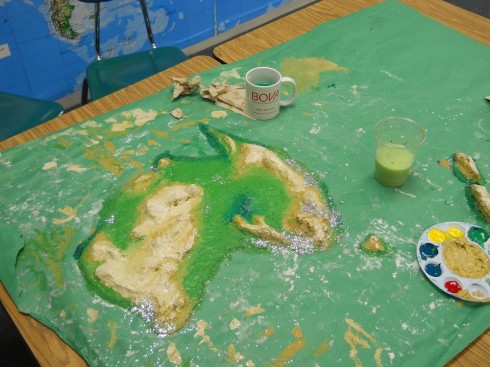
The Shaded Relief Archive is a great source of continental scale shaded relief maps. Dr. A. used them when the middle-schoolers built their 3d models of Australia and Antarctica for geography.
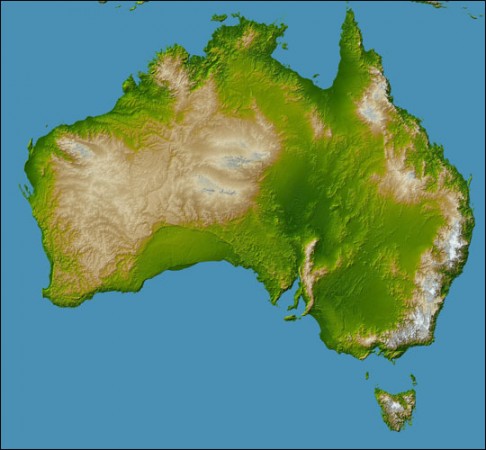
NASA’s Earth Observatory is another great source.
Middle and High School … from a Montessori Point of View

The Shaded Relief Archive is a great source of continental scale shaded relief maps. Dr. A. used them when the middle-schoolers built their 3d models of Australia and Antarctica for geography.

NASA’s Earth Observatory is another great source.

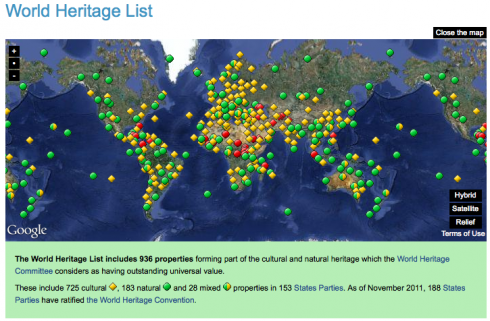
Cahokia‘s just one of almost a thousand sites around the world that UNESCO considers to form, “part of the cultural and natural heritage” of the world that has “outstanding universal value.”
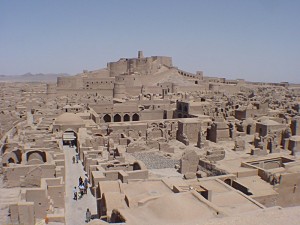
It’s a remarkable selection of places, from natural geological wonders like the Grand Canyon, to biological preserves like Peru’s Manú National Park, to cultural landscapes like that of Bam, Iran.
The long, detailed descriptions of the importance of these sites makes the World Heritage List website is a remarkable resource for cultural and physical geography.
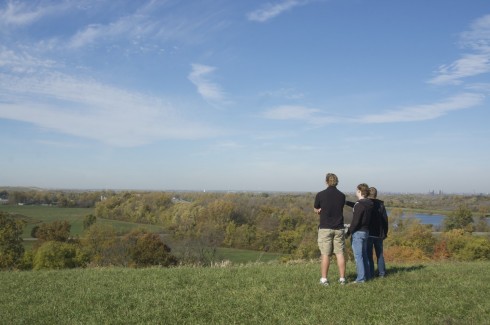
Almost a thousand years ago, 20,000 people lived at a place called Cahokia. At the center of their city, was the largest artificial mound in North America. A large part of Cahokia’s success is surely its location: near the confluence of the Mississippi and Missouri Rivers — just across the Mississippi from modern-day St. Louis. Yet less than 400 years later (see timeline) the city was abandoned, and no one is quite sure what happened.
Our middle and high school took a trip out to Cahokia last month. It was during the same intercession between quarters when we visited the Laumeier Sculpture Park, the Da Vinci Exhibition, and did our brief biological survey of the campus.
The elevation of the main mound, sitting on the flat Mississippi flood plain, with the St. Louis skyline in the distance, was a great place to talk about the importance of physical geography in the location of cities (your biggest cities are always going to be on rivers, or the ocean or, often, both) and to reflect on how history repeats itself — a once thriving metropolis is nothing now but displaced piles of alluvium and mystery.
View Cahokia in a larger map
Cahokia is a World Heritage Site, and it has an excellent museum. I particularly liked the detail in their life-sized reconstruction of a section of the city.
Their website is also good. Apart from the timeline, mentioned above, they have a nice interactive map for details about each of the numerous mounds, and a long page about the archeology.
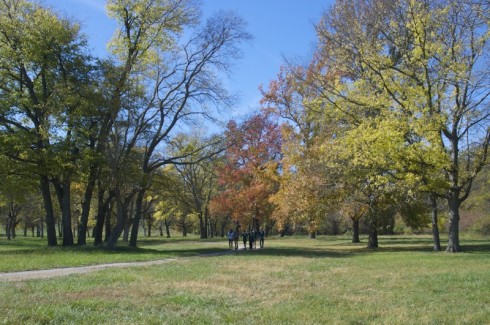
The site is pretty big, so you can spend a fair amount of time exploring. Fall, when the leaves have turned color, and the air has cooled a little, is an excellent time to visit.
Since we’re working on geometry this cycle, I thought it would be an interesting exercise to think about how we could use geometry to think about how the strength of tsunamis decreases with distance from the source.
Of course, we’ll have to do this using some intense simplification so we can actually apply the tools we have available. The first is to approximate the tsunami as a circular wall of water centered on the epicenter of the earthquake.
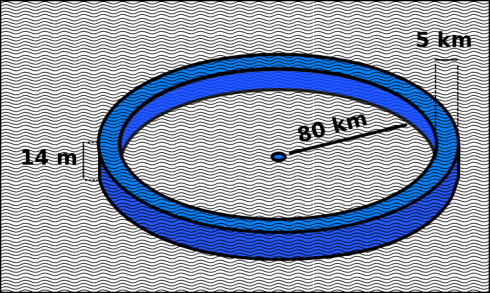
This lets us figure out the volume of the wave pretty easily because we know that the volume of a cylinder is:
(1)

The size of the circular water wall we approximate from the reports from Japan. The maximum height of the wave at landfall was somewhere in the range of 14 m along the northern Japanese coast, which was about 80 km from the epicenter. Just as a wild guess, I’m assuming that the “effective” width of the wave is 1 km.
Typically, in deep water, a tsunami can have a wavelength greater than 500 km (Nelson, 2010; note that our width is half the wavelength), but a wave height of only 1 m (USSRTF). When they reach the shallow water the wave height increases. The Japanese tsunami’s maximum height was reportedly about 14 m.
At any rate, we can figure out the volume of our wall of water by calculating the volume of a cylinder with the middle cut out of it. The radius of our inner cylinder is 80 km, and the radius of the outer cylinder is 80 km plus the width of the wave, which we say here is 1 km.
However, for the sake of algebra, we’ll call the radius of the inner cylinder, ri and the width of the wave as w. Therefore the inner cylinder has a volume of:
(2)

So the radius of the outer cylinder is the radius of the inner cylinder plus the width of the wave:
(3)

which means that the volume of the outer cylinder is:
(4)

So now we can figure out the volume of the wave, which is the volume of the outer cylinder minus the volume of the inner cylinder:
(5)

(6)

Now to simplify, let’s expand the first term on the right side of the equation:
(7)

Now let’s collect terms:
(8)

Take away the inner parentheses:
(9)

and subtract similar terms to get the equation:
(10)

Now we can just plug in our estimates of width and height to get the volume of water in the wave. We’re going to assume, later on, that the volume of water does not change as the wave propagates across the ocean.
(11)

rearrange so the coefficients are in front of the variables:
(12)

So, at 80 km, the volume of water in our wave is:
(13)

(14)

Okay, now we want to know what the height of the tsunami will be at any distance from the epicenter of the earthquake. We’re assuming that the volume of water in the wave remains the same, and that the width of the wave also remains the same. The radius and circumference will certainly change, however.
We take equation (10) and rearrange it to solve for h by first dividing by rearranging all the terms on the right hand side so h is at the end of the equation (this is mostly for clarity):
(15)

Now we can divide by all the other terms on the right hand side to isolate h:
(16)

so:
(17)

which when reversed looks like:
(18)

This is our most general equation. We can use it for any width, or radius of wave that we want, which is great. Anyone else who wants to calculate wave heights for other situations would probably start with this equation (and equation (15)).
So we can now figure out the height of the wave at any radius from the epicenter of the earthquake. To double check our algebra, however, let’s plug in the volume we calculated, and the numbers we started off with, and see if we get the same height (14 m).
First, we’ll use all our initial approximations so we get an equation with only two variables: height (h) and radial distance (ri). Remember our initial conditions:
w = 1000 m
ri = 80,000 m
hi = 14 m
we used these numbers in equation (10) to calculate the volume of water in the wave:
Vw = 7081149841 m3
Now using these same numbers in equation (18) we get:
(19)

which simplifies to:
(20)

So, to double-check we try the radius of 80 km (80,000 m) and we get:
h = 14 m
Aha! it works.
Now, what about Hawaii? Well it’s about 6000 km away from the earthquake, so taking that as our radius (in meters of course), in equation (20) we get:
(21)

which is:
h = 0.19 m
This is just 19 cm!
All the way across the Pacific, Lima, Peru, is approximately 9,000 km away, which, using equation (20) gives:
h = 0.13 m
So now I’m curious about just how fast the 14 meters drops off to less than 20 cm. So I bring up Excel and put together a spreadsheet of tsunami height at different distances. Plot on a graph we get:
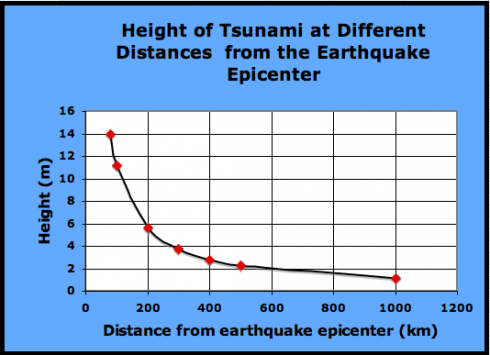
So the height of the tsunami drops off relatively fast. Within 1000 km of the earthquake the height has dropped by 90%.
This is all very nice, a cute little exercise in algebra, but is it useful? Does it come anywhere close to reality? We can check by comparing it to actual measurements; the same ones used by NOAA to compare to their model (see here).

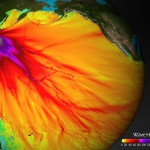
The graph shows a maximum height of about 60 cm, which is about three times larger than our model. NOAA’s estimate is within 20% of the actual maximum heights, but they’ve spent a bit more time on this problem, so they should be a little better than us. You can find all the gruesome details on NOAA’s Center for Tsunami Research site’s Tsunami Forecasting page.
1. The maximum height of a tsunami depends on how much up-and-down motion was caused by the earthquake. ScienceDaily reports on a 2007 article that tried to figure out if you could predict the size of a tsunami based on the type of earthquake that caused it.
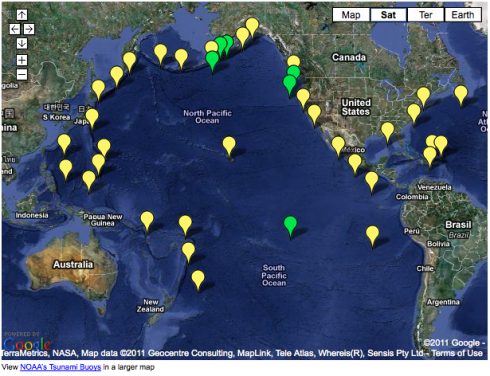
2. Using buoys in the area, NOAA was able to detect and warn about the Japanese earthquake in about 9 minutes. How do they know where to place the buoys? Plate tectonics.
The equations starting with (7) did not have the 2 on the riw term. That has been corrected. Note that the numerical calculations were correct so they have not changed. – Thanks to Spencer and Claude for helping me catch that.
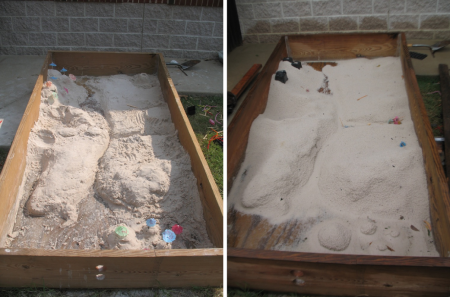
We left the sandbox uncovered under last week’s heavy rain, and the result was a new perspective on erosion, sedimentation and the evolution of landforms.
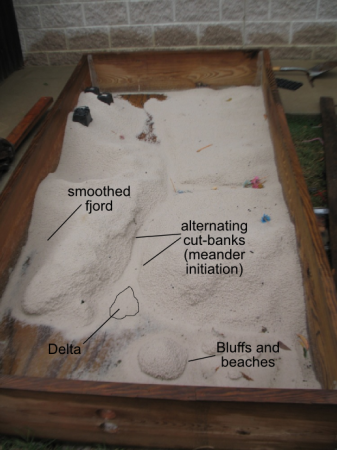
Nice, sharp, hand-sculpted valleys were smoothed out by the raindrop splatters. The beautifully steep sided fjord on the lower left, in particular, eroded into the gentler slopes of a fluvial surface.
This process is diffusional. Sand moves from high peaks to fill in the low valley floors, evolving toward a softer, flatter land surface in the same way dye in pan diffuses from the high concentration droplet to a more uniform distribution.
There was enough rain that water pooled, for a little while, at the lower end of the sandbox. This allowed the formation of a beautiful little delta from the main river, which was most remarkable to observe while it was raining because the channel bifurcated at its mouth with running water to the left and right of the depositional landform.
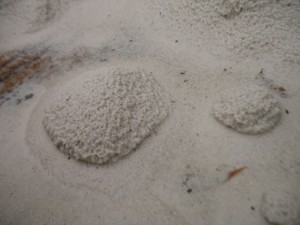
The standing water in the “ocean” also caused the islands to partially erode at the edges to create steep bluffs overlooking sandy beaches.
And finally, if you looked carefully at the sides of the river channel you could see where the water was beginning to cut into the banks, a little offset on either side, to start the formation of meanders.
Instead of doing the Island of Podiatry in the sandbox, I decided add a practical exercise as part of their Social World test.
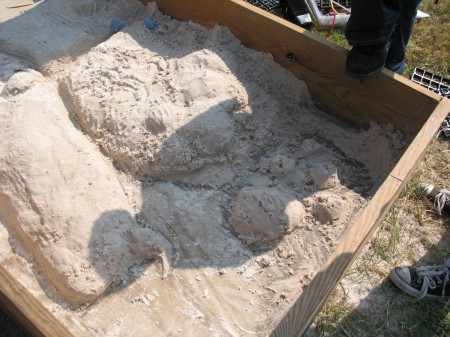
Half the class, the first to finish the written portion of the test, were instructed, as a group, to create as many physiographic features as they could in the sandbox. Tomorrow, the other half will have to try to identify as many features as they can.
The first group did a very good job. The kids seemed to enjoy working with the sand, and little details, like the difference between a bay and a gulf, quickly became apparent.
It’ll be interesting to see how the other half does with identification. I could not prevent myself from adding a fjord and cirque even though we have not seen them in class. The fjord should at least be recognized as a valley (definitely a steep sided valley), but hopefully this will allow a moment to talk about post-glacial features. Of course, thinking about it, I should probably add a moraine or subsurface ridge to complete the set.
