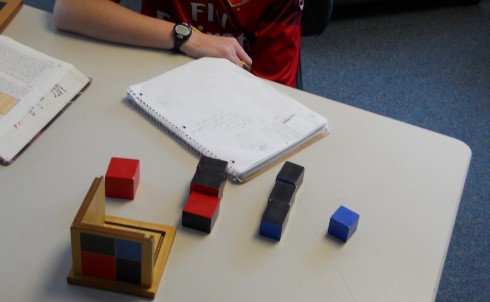
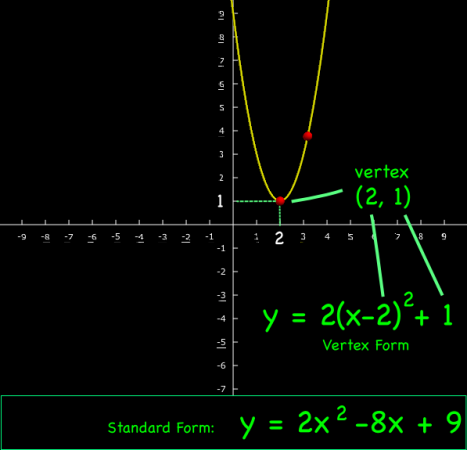
So that my students could more easily check their answers graphically, I put together a page with a more complete analysis of parabolas (click this link for more details).
[inline]
Analyzing Parabolas
Solution by Factoring:
y = x2 x
[script type=”text/javascript”]
var width=500;
var height=500;
var xrange=10;
var yrange=10;
mx = width/(2.0*xrange);
bx = width/2.0;
my = -height/(2.0*yrange);
by = height/2.0;
function draw_9239(ctx, polys) {
t_9239=t_9239+dt_9239;
//ctx.fillText (“t=”+t, xp(5), yp(5));
ctx.clearRect(0,0,width,height);
polys[0].drawAxes(ctx);
ctx.lineWidth=2;
polys[0].draw(ctx);
polys[0].write_eqn2(ctx);
//polys[0].y_intercepts(ctx);
//write intercepts on graph
// SHOW VERTEX
if (show_vertex_ctrl_9239.checked==true) {
polys[0].draw_vertex(ctx);
document.getElementById(‘vertex_pos_9239’).innerHTML = “(“+polys_9239[0].vertex.x.toPrecision(2)+ ” , “+polys_9239[0].vertex.y.toPrecision(2)+ ” )”;
} else { document.getElementById(‘vertex_pos_9239’).innerHTML = “”;}
// SHOW FOCUS
if (show_focus_ctrl_9239.checked==true) {
polys[0].draw_focus(ctx);
document.getElementById(‘focus_pos_9239’).innerHTML = “(“+polys_9239[0].focus.x.toPrecision(2)+ ” , “+polys_9239[0].focus.y.toPrecision(2)+ ” )”;
} else { document.getElementById(‘focus_pos_9239’).innerHTML = “”;}
// SHOW DIRECTRIX
if (show_directrix_ctrl_9239.checked==true) {
polys[0].draw_directrix(ctx);
document.getElementById(‘directrix_pos_9239’).innerHTML = polys[0].directrix.get_eqn2(“y”,”x”,”html”);
polys[0].directrix.write_eqn2(ctx, polys[0].directrix.get_eqn2(“directrix: y”));
} else { document.getElementById(‘directrix_pos_9239’).innerHTML = “”;}
// SHOW AXIS
if (show_axis_ctrl_9239.checked==true) {
polys[0].draw_parabola_axis(ctx);
document.getElementById(‘axis_pos_9239’).innerHTML = “x = “+polys[0].vertex.x.toPrecision(2);
}
//SHOW INTERCEPTS
ctx.textAlign=”center”;
if (show_intercepts_ctrl_9239.checked==true) {
polys[0].x_intercepts(ctx);
ctx.fillText (‘x intercepts: (when y=0)’, xp(6), yp(8));
//ctx.fillText (‘intercepts=’+polys[0].x_intcpts.length, xp(5), yp(-5));
if (polys[0].order == 2) {
if (polys[0].x_intcpts.length > 0) {
line = “0 = “;
for (var i=0; i 0.0) { sign=”-“;} else {sign=”+”;}
line = line + “(x “+sign+” “+ Math.abs(polys[0].x_intcpts[i].toPrecision(2))+ “)”;
}
ctx.fillText (line, xp(6), yp(7));
for (var i=0; i 0) {
for (var i=0; i2 “+polys[0].bsign+” “+Math.abs(polys[0].b.toPrecision(2))+” x “+ polys[0].csign+” “+Math.abs(polys[0].c.toPrecision(2))+”
“;
solution = solution + ‘Factoring: ‘;
if (polys[0].x_intcpts.length > 0) {
solution = solution + ‘0 = ‘;
for (var i=0; i 0.0) { sign=”-“;} else {sign=”+”;}
solution = solution + “(x “+sign+” “+ Math.abs(polys[0].x_intcpts[i].toPrecision(2))+ “)”;
}
solution = solution + ‘
‘;
solution = solution + ‘Set each factor equal to zero:
‘;
for (var i=0; i 0.0) { sign=”-“;} else {sign=”+”;}
solution = solution + “x “+sign+” “+ Math.abs(polys[0].x_intcpts[i].toPrecision(2))+ ” = 0 “;
}
solution = solution + ‘
and solve for x:
‘;
for (var i=0; i‘;
}
document.getElementById(‘equation_9239’).innerHTML = solution;
}
else if (polys[0].order == 1) {
solution = solution + ‘
‘;
solution = solution + “y = “+” “+Math.abs(polys[0].b.toPrecision(2))+” x “+ polys[0].csign+” “+Math.abs(polys[0].c.toPrecision(2))+”
“;
solution = solution + ‘
Set y=0 and solve for x:
‘;
solution = solution + ” 0 = “+” “+Math.abs(polys[0].b.toPrecision(2))+” x “+ polys[0].csign+” “+Math.abs(polys[0].c.toPrecision(2))+”
“;
solution = solution + ‘ ‘;
solution = solution + (-1.0*polys[0].c).toPrecision(2) +” = “+” “+Math.abs(polys[0].b.toPrecision(2))+” x “+”
“;
solution = solution + ‘ ‘;
solution = solution + (-1.0*polys[0].c).toPrecision(2)+”/”+polys[0].b.toPrecision(2)+” = “+” x “+”
“;
solution = solution + ‘ ‘;
solution = solution + “x = “+ (-1.0*polys[0].c/polys[0].b).toPrecision(4)+”
“;
document.getElementById(‘equation_9239’).innerHTML = solution;
}
}
function update_form_9239 () {
a_coeff_9239.value = polys_9239[0].a+””;
b_coeff_9239.value = polys_9239[0].b+””;
c_coeff_9239.value = polys_9239[0].c+””;
av_coeff_9239.value = polys_9239[0].a+””;
hv_coeff_9239.value = polys_9239[0].h+””;
kv_coeff_9239.value = polys_9239[0].k+””;
}
//init_mouse();
var c_9239=document.getElementById(“myCanvas_9239”);
var ctx_9239=c_9239.getContext(“2d”);
var change = 0.0001;
function create_lines_9239 () {
//draw line
//document.write(“hello world! “);
var polys = [];
polys.push(addPoly(1,6, 5));
// polys.push(addPoly(0.25, 1, 0));
// polys[1].color = ‘#8C8’;
return polys;
}
var polys_9239 = create_lines_9239();
var x1=xp(-10);
var y1=yp(1);
var x2=xp(10);
var y2=yp(1);
var dc_9239=0.05;
var t_9239 = 0;
var dt_9239 = 100;
//end_ct = 0;
var st_pt_x_9239 = 2;
var st_pt_y_9239 = 1;
var show_vertex_9239 = 1; //1 to show vertex on startup
var show_focus_9239 = 1; // 1 to show the focus
var show_intercepts_9239 = 1; // 1 to show the intercepts
var show_directrix_9239 = 1; // 1 to show the directrix
var show_axis_9239 = 1; //1 to show the axis of the parabola
var move_dir_9239 = 1.0; // 1 for up
//document.getElementById(‘comment_spot’).innerHTML = polys_9239[0].a+” “+polys_9239[0].b+” “+polys_9239[0].c+” : “+polys_9239[0].h+” “+polys_9239[0].k+” “;
//standard form
var a_coeff_9239 = document.getElementById(“a_coeff_9239”);
var b_coeff_9239 = document.getElementById(“b_coeff_9239”);
var c_coeff_9239 = document.getElementById(“c_coeff_9239”);
//vertex form
var av_coeff_9239 = document.getElementById(“av_coeff_9239”);
var hv_coeff_9239 = document.getElementById(“hv_coeff_9239”);
var kv_coeff_9239 = document.getElementById(“kv_coeff_9239”);
//options
var show_vertex_ctrl_9239 = document.getElementById(“show_vertex_9239”);
if (show_vertex_9239 == 0) {show_vertex_ctrl_9239.checked=false;
} else {show_vertex_ctrl_9239.checked=true;}
var show_focus_ctrl_9239 = document.getElementById(“show_focus_9239”);
if (show_focus_9239 == 0) {show_focus_ctrl_9239.checked=false;
} else {show_focus_ctrl_9239.checked=true;}
var show_intercepts_ctrl_9239 = document.getElementById(“show_intercepts_9239”);
if (show_intercepts_9239 == 0) {show_intercepts_ctrl_9239.checked=false;
} else {show_intercepts_ctrl_9239.checked=true;}
var show_directrix_ctrl_9239 = document.getElementById(“show_directrix_9239”);
if (show_directrix_9239 == 0) {show_directrix_ctrl_9239.checked=false;
} else {show_directrix_ctrl_9239.checked=true;}
var show_axis_ctrl_9239 = document.getElementById(“show_axis_9239”);
if (show_axis_9239 == 0) {show_axis_ctrl_9239.checked=false;
} else {show_axis_ctrl_9239.checked=true;}
update_form_9239();
//document.write(“test= “+c_coeff_9239.value+” “+polys_9239[0].c);
setInterval(“draw_9239(ctx_9239, polys_9239)”, dt_9239);
a_coeff_9239.onchange = function() {
//polys_9239[0].a = parseFloat(this.value);
polys_9239[0].set_a(parseFloat(this.value));
polys_9239[0].update_vertex_form_parabola();
update_form_9239();
}
b_coeff_9239.onchange = function() {
//polys_9239[0].b = parseFloat(this.value);
polys_9239[0].set_b(parseFloat(this.value));
polys_9239[0].update_vertex_form_parabola();
update_form_9239();
}
c_coeff_9239.onchange = function() {
//polys_9239[0].c = parseFloat(this.value);
polys_9239[0].set_c(parseFloat(this.value));
polys_9239[0].update_vertex_form_parabola();
update_form_9239();
}
av_coeff_9239.onchange = function() {
//polys_9239[0].a = parseFloat(this.value);
polys_9239[0].set_a(parseFloat(this.value));
polys_9239[0].update_standard_form_parabola();
update_form_9239();
}
hv_coeff_9239.onchange = function() {
polys_9239[0].h = parseFloat(this.value);
polys_9239[0].update_standard_form_parabola();
polys_9239[0].set_order()
update_form_9239();
}
kv_coeff_9239.onchange = function() {
polys_9239[0].k = parseFloat(this.value);
polys_9239[0].update_standard_form_parabola();
polys_9239[0].set_order()
update_form_9239();
}
//draw_9239();
//document.write(“x”+x2+”x”);
//ctx_9239.fillText (“n=”, xp(5), yp(5));
[/script]
[/inline]
Converting the forms
The key relationships are the ones to convert from the standard form of the parabolic equation:
| |
 |
(1) |
to the vertex form:
| |
 |
(2) |
If you multiply out the vertex equation form you get:
| |
y = a x2 – 2ah x + ah2 + k |
(3) |
When you compare this equation to the standard form of the equation (Equation 1), if you look at the coefficients and the constants, you can see that:
To convert from the vertex to the standard form use:
Going the other way,
To convert from the standard to the vertex form of parabolic equations use:
Although it is sometimes convenient to let k not depend on coefficients from its own equation:
| |

|
(10) |
The Vertex and the Axis
The nice thing about the vertex form of the equation of the parabola is that if you want the find the coordinates of the vertex of the parabola, they’re right there in the equation.
Specifically, the vertex is located at the point:
| |

|
(11) |
The axis of the parabola is the vertical line going through the vertex, so:
The equation for the axis of a parabola is:
| |

|
(12) |
Focus and Directrix
Finally, it’s important to note that the distance (d) from the vertex of the parabola to its focus is given by:
| |

|
(13) |
Which you can just add d on to the coordinates of the vertex (Equation 11) to get the location of the focus.
| |

|
(14) |
The directrix is just the opposite, vertical distance away, so the equation for the directrix is the equation of the horizontal line at:
| |

|
(15) |
References
There are already some excellent parabola references out there including:
![]() (1)
(1)![]() (2)
(2)![]() and,
and,![]()
![]()
![]() (3)
(3)![]() (4)
(4)![]() and,
and,![]()
![]()
![]()
![]() (5)
(5)![]() ,
,![]() and,
and,![]() ,
,![]()
