Scientists tracking oil plumes

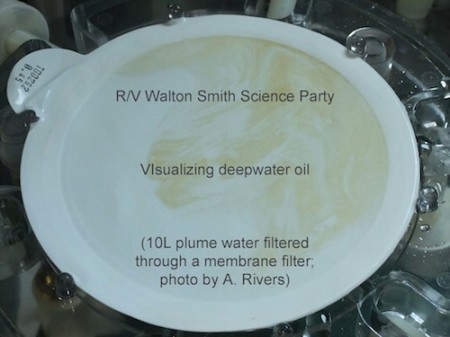
Filter after 10L of plume water was passed through it -- visible oil! (from Joye, 2010)

As oil continues to leak from the damaged well in the Gulf of Mexico and the surface slick is affecting more and more of the coastline, scientists now using research vessels to track the underwater plumes spreading at depth throughout the gulf.
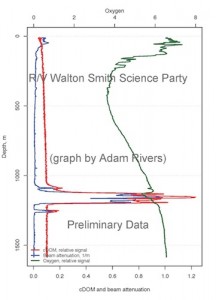
Dissolved oxygen, CDOM and beam attenuation with depth (from Joye, 2010).

Satellite imagery from NASA only shows what’s at the surface. To find the underwater plumes, researchers on boats lower instruments on cables that measure the chemistry of the water. Certain chemicals, like colored dissolved organic matter (CDOM) are produced when there is a lot of oil in the water.

Dr. Samantha Joye, from the University of Georgia, is the lead scientist on one such vessel. She started the Gulf Oil Blog where she describes her ongoing work in the gulf and answers readers questions. It is an excellent resource. A great demonstration of science in action, working on a practical problem but using techniques and methods developed over time for answering more abstract questions.
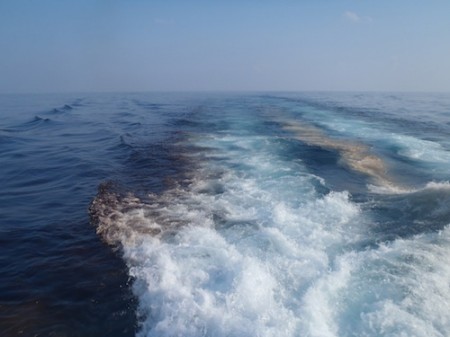
Oil in the wake of a ship (from Joye, 2010)

Segway lessons

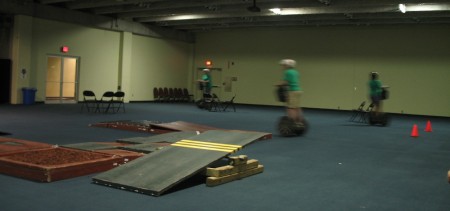
From playing with robots we tried an actual application of robotics. We had the Segways 101 course at the St. Louis Science Center.

The lesson itself was fun, with an entertaining video of people falling off Segways. They also had a little obstacle course to let you try doing all of the things the video told you not to do (but most of it was for the more advanced class).

Afterward, we discussed the fact that this too was robotics and a pretty advanced application at that. We did not talk much about how the Segways were supposed to revolutionize urban transportation but students did recognize the fact that aesthetics were a major impediment to their broader adoption.

The price was a bit steep however, and I’m a little conflicted about if it was worth it.

Glassworks

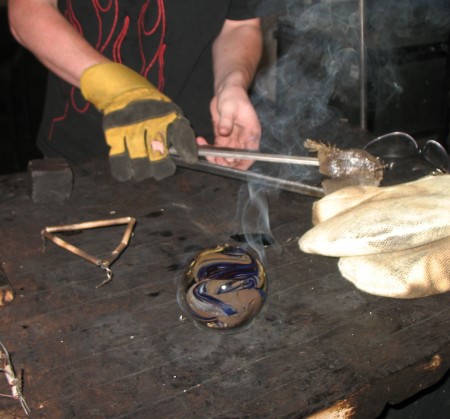
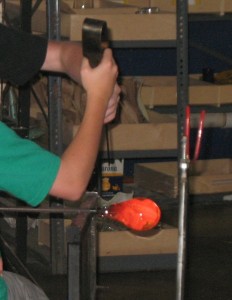
Molten glass, upwards of 2000 degrees, cools slowly, quickly, slow enough to pull, twist, fast enough to feel the brittleness between metal tweezers in seconds. Runny to viscous as it cools. Change of state — freezing — feel it in the glass.

Tweezers and jacks keep hot glass at a distance. Third class levers require balance and firmness to control their mechanical advantage.

Glass, silica, SiO2. Quartz crystals, ordered array of molecules. Glass, no organization, amorphous.

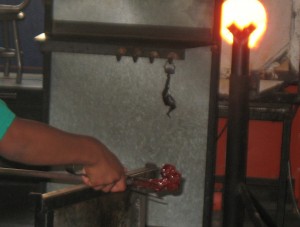
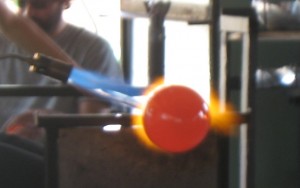
Furnaces blast hot, you can see the yellow-orange color, you can feel the hard infra-red light, thermal energy. IR – long wave – less energetic. When extra heat is needed, the blue/ultra-violet flame of propane (mixed with oxygen). UV – short wave – high energy – hard on the eyes though you can’t see it.

Combustion needs three things, heat, fuel and oxygen. Propane, C3H8, not methane, CH4 – the greater energy density. Propane, C3H8, not butane, C4H10 – is a gas not a liquid. To burn real hot needs extra oxygen.

Propane torch.

Conservation is a challenge. Furnaces –> heat –> lots of energy –> bad. Natural light, big doors, lots of windows. Recycle glass (at least the clear glass). No need for heat in the winter. Drink lots of water in the summer.

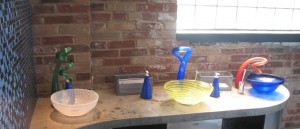
3rd Degree Glass Factory, make your own paperweights. About 12 minutes per person. Excellent way to spend a morning. Really cool faucets and water basins in the bathroom.

Nashville flooding and mid-latitude cyclones

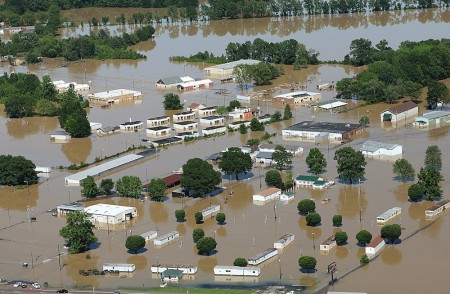
Nashville, TN, May 4, 2010. (photo by David Fine/FEMA)
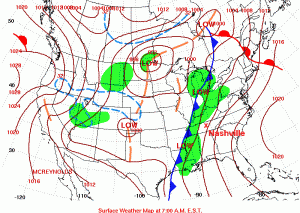
Daily weather map for May 2nd, 2010. Note the cold front heading toward Nashville. Map from the Hydrometeorological Prediction Center.

Over 30 cm of rainfall in just two days resulted in extensive flooding in Nashville, TN, last week. The precipitation was produced by one of those typical mid-latitude cyclones that sweep across the United States, from west to east, every spring and fall. The Boston Globe has some amazing picture of the flooding.

The news media tends to have the most dramatic photographs of disasters, but the Federal Emergency Management Agency (FEMA) also tends to have good images from their aerial surveys (like the image at the top of this post). And images produced by the government are in the public domain so you don’t have to worry about using them.

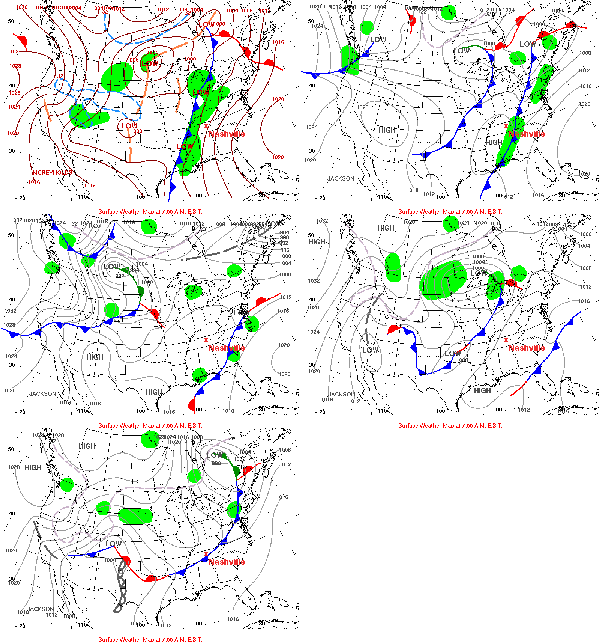
May 2-6 fronts. Animation generated using images from the HPC.

For discussing warm fronts, cold fronts and mid-latitude cyclones, NOAA‘s Hydrometeorological Prediction Center (HPC) is a great resource. You can find an archive of daily weather maps for the U.S. that you can click through to see the fronts move.

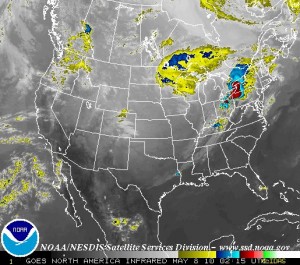
Infra-red satellite image of the continental U.S.. Note the alignment of the clouds and precipitation with the fronts in the first (static) weather map above. (Image from GOES).

Satellite imagery usually complements to the frontal weather maps very well. Most satellites orbit around the Earth pretty quickly, at just the right orbital speed that the centrifugal force just balances the Earth’s gravity so the satellite does not crash into the atmosphere or escape into space. Some satellites are set into orbit a bit further out so that they can rotate with the Earth, effectively staying above the same place all the time. NOAA has a few of these geostationary satellites monitoring the weather around the world, and you can get real-time images from the Geostationary Satellite Server. There used to be archived satellite images but I can’t seem to find them at the moment.

Learning science

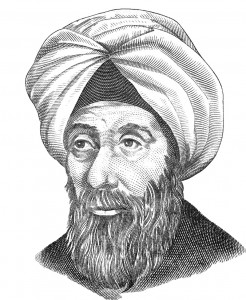
al-Hassan Ibn al-Haytham (b. 965-1039) (Image from Wikipedia)

Science is, at its core, hypothesis testing. To learn science learn the scientific method: figure out the precise question to solve (as best you can); come up with an answer you think might work (hypothesis); test it; and repeat as necessary while modifying the hypothesis. Almost all science experiments for middle school through college involve following a set of instructions in the lab manual. Only in independent research projects do students actually go through the scientific process and then it’s difficult because they don’t have the experience.

Part of the problem is that it takes time. Time to muddle through the though process of trying to figure out what exactly is a tractable question to solve. Time to come up to with a reasonable, testable hypothesis. Time to figure out how to test it. Time for iterating through the process again, although, once you’ve set up your experiment the first time doing it again and again is not that hard or time-consuming.

With our Montessori Middle School’s six-week cycle of work, and even with the two weeks dedicated to the Natural World, students should be possible to get through this process for at least one problem. They would probably have to dedicate the two weeks to a single problem/experiment and it would probably be terribly slow in the beginning.

To discover the truth about nature, Ibn a-Haitham reasoned, one had to eliminate human opinion and allow the universe to speak for itself through physical experiments. “The seeker after truth is not one who studies the writings of the ancients and, following his natural disposition, puts his trust in them,” the first scientist wrote, “but rather the one who suspects his faith in them and questions what he gathers from them, the one who submits to argument and demonstration.” – Steffens (2008) (Ibn Al-Haytham: First Scientist)

Integrating Eyjafjallajökull

Second fissure, viewed from the north, on 2 April 2010 (from Wikipedia)

Current events often generate the teachable moments we’re always seeking in order to strike students’ imagination. The eruption of Eyjafjallajökull is a prime example. I’ve already used it to point out the intersection of geothermal energy and plate tectonics, but there is so much more.

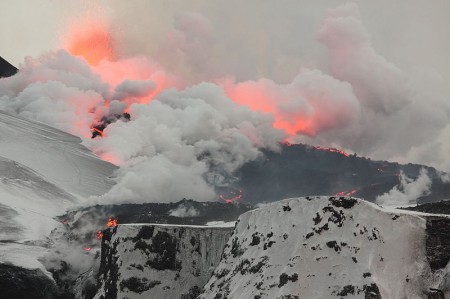
The second eruption in Eyjafjallajökull. Seen from Fljótshlíð on 20 April 2010 (from Wikipedia).

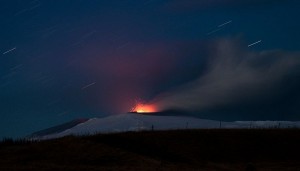
Eyjafjallajökull has been a wonderful subject for the art of photography. The image above is a great example but the time-lapse photos have been excellent. The photo to the right captures not just the stars streaking across the sky with a three minute exposure but the fiery red arcs of the volcanic ejecta.

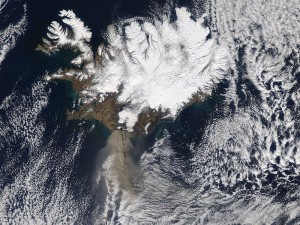
The MODIS instrument on NASA's Aqua satellite captured an ash plume from Eyjafjallajökull Volcano over the North Atlantic at 13:20 UTC on 17 April 2010 (from NASA via Wikipedia).

One of the major benefits of the space program so far has been its Earth observing satellites. There is so much going on in the image to the left that it’s hard to know where to start. Why are there all those clouds over Iceland? (warmer land mass creates convection); what’s with the two plumes from the volcano, one concentrated high level and one disperse low level plume; fjords on the upwind side of the island and the straightened coastline on the lee; greenish plumes of glacier-ground, rock flour discharging into the ocean.

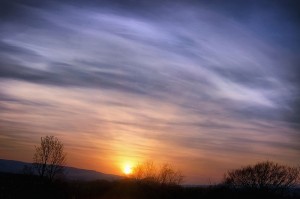
Dust particles suspended in the atmosphere scatter light from the setting sun, generating 'volcanic lavenders' like this one over the flight path of Leeds-Bradford Airport in England during the aviation shutdown. (from Wikipedia).

The dinosaurs were done in either by an asteroid impact in the Yucatan or the eruption of the massive flood volcanoes in Deccan, India, or quite probably both. Both of these events launched an enormous amount of ash, gas and fine particles into the upper atmosphere, blocking sunlight, causing global cooling. Well the ash from Eyjafjallajökull and the sulfur dioxide gas may be having a similar effect on Europe, and if there’s enough of it, on the world. The 1992 eruption of Mt. Pinatubo cooled the globe by about half a degree Celsius.

Hydrogen fuel

Hydrogen is an alternative source of fuel (alternative to fossil fuels), but it can be produced from renewable or non-renewable sources. PBS and Scientific American Frontiers have a nice video on hydrogen fuel. They first visit a lab producing hydrogen fuel cells. The second part of the program visits Iceland is trying to use geothermal energy to create the hydrogen. They also discuss producing hydrogen from solar-electric and algae.

Geothermal energy and plate tectonics

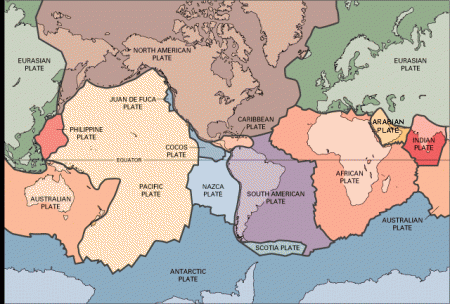
Major tectonic plates (from USGS).
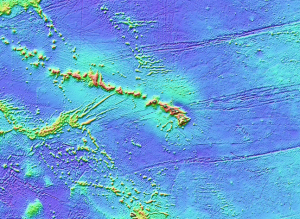
Seafloor topography around the Hawaiian Hotspot (from NCDC)
Seafloor topography around the Hawaiian Hotspot (from NOAA)

The question came up about where are good places for geothermal energy, and the answer, of course, was to introduce plate tectonics. It was a quick introduction, and a refresher for the 8th graders, but the interest was there and it seemed impactful.

It also provided a link to talk about the Icelandic volcano that’s been disrupting air traffic in Europe. NASA has an amazing picture of the eruption on its Picture of the Day for April 19th.

Google Maps is a great tool for showing features like the mid-ocean ridges (use the satellite view), zooming in and out of the mountain ranges, tracing the Hawaii hotspot and watching East Africa split apart.

[googleMap name=”Mozambique Channel” description=”East African Rifting” width=”400″ height=”350″ mapzoom=”4″ mousewheel=”false” directions_to=”false”]-21, 40[/googleMap]