
NPR has a nice article on how physicists come up with new elements (in supercolliders) and then name them.
Middle and High School … from a Montessori Point of View
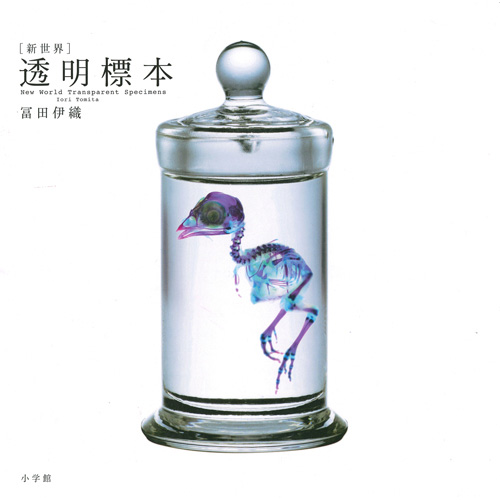
After the joy of playing around with microscopy and staining last fall, it’s no surprise that someone has taken the science of staining and specimen preservation and turned it into art.
Iori Tomita has done an amazing job at making visible the internal organs of the specimens.
Using a method that dissolves an animals natural proteins, Tomita is able to preserve these deceased animals with striking detail–highlighting the finest and most delicate skeleton structures.
To further enhance the visual appeal of these ornate skeletons, Tomita selectively injects different colored dies into hard bones and soft bones to create a 3-d effect. Without the addition of the dye, the animals remain translucent.
— Michael (2010): New World Transparent Specimens Turns Preservation Into Modern Art
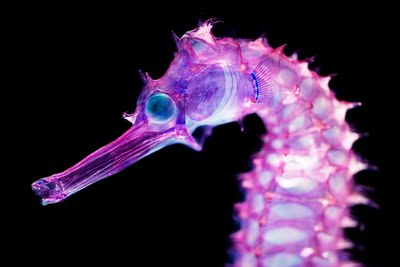
Tomita’s website has some excellent photographs, and there appear to be two books available from Amazon.com.jp. More pictures can be found online here and here. Lisa Stinson at Wired has more pictures and details on the method.
The BBC has an excellent article on the Alpha Magnetic Spectrometer (AMS) launched on the second to last shuttle flight to investigate the origins of the universe. NASA’s page is giving regular updates.
What’s nice is that the basic physics of magnetic spectrometers, where magnets are used to deflect the motion of charged particles, should be accessible to middle school students once they get into electricity and magnetism.
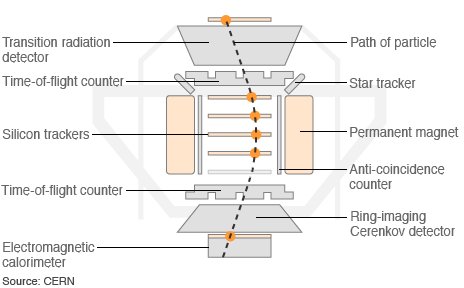
Transition Radiation Detector determines highest-energy particle velocities
Silicon Trackers follow particle paths; how they bend reveals their charge
Permanent Magnet is core component of AMS and makes particles curve
Time-of-flight Counters determine lowest-energy particle velocities
Star Trackers scan star fields to establish AMS’s orientation in space
Cerenkov Detector makes accurate velocity measurements of fast particles
Electromagnetic Calorimeter measures energy of impacting particles
Anti-coincidence Counter filters signal from unwanted side particles— Amos (2011): Alpha Magnetic Spectrometer to go on Endeavour shuttle on the BBC.
For additional information, that really gets into the nuts and bolts, you can go CERN’s technical site or get more general info at their public site, which has a wonderful set of videos and animations.
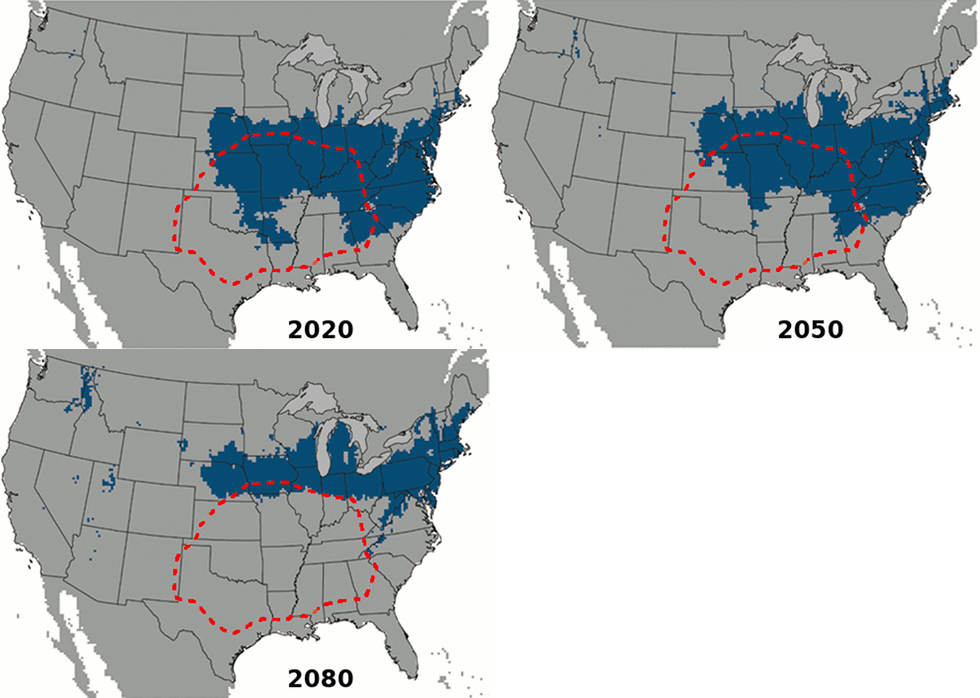
Just in time for us to learn about global change, this interesting study on the expanding range of brown recluse spiders came out. Once restricted to the southern U.S. and the midwest, future climate change will allow them to expand north to Minnesota and east into Pennsylvania.
The researchers, Saupe et al. (2011), used ecological niche modeling. This method takes known information about where the spiders live, such as climate (e.g. summer temperatures) or topography (e.g. mountains versus plains), to figure out the current extent of their ecological niche. Then they use climate models to figure out where those same conditions will apply in the future. Thus the spiders march north.
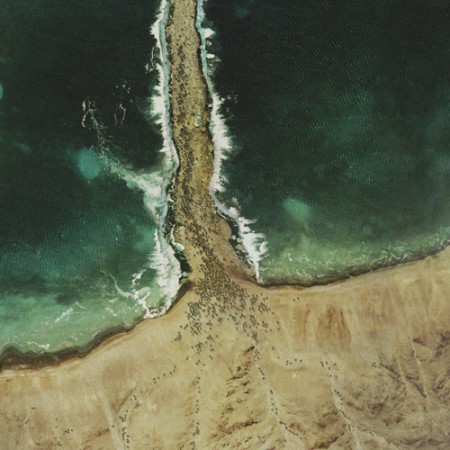
The Glue Society has a most interesting set of satellite images modified to look like major biblical scenes. CreativeReview has more pictures and details, including of the crucifixion and Noah’s Ark.
“We like to disorientate audiences a little with all our work. And with this piece we felt technology now allows events which may or may not have happened to be visualized and made to appear dramatically real,” say The Glue Society’s James Dive. “As a method of representation satellite photography is so trusted, it has been interesting to mess with that trust.”
— CreativeReview (2007): The Bible According To Google Earth
I think this topic came up when we were talking about atmospheric circulation. The question was about if the winds generated descending, diverging air could have parted the Red Sea. The answer was no, because the general atmospheric circulation system is a thing of climate — averages of the weather — while any winds strong enough to part the red sea would be actual weather, like the storms we seem to have been seeing every day for the last few weeks.
Oddly enough, just last year researchers from the University Corporation for Atmospheric Research (UCAR) did a computer model that showed that hurricane force winds from the northwest could have uncovered an underwater reef to allow Moses his passage (the article is Drews and Han, 2010).
However, the scientists found:
[The] reef would have had to be entirely flat for the water to drain off in 12 hours. A more realistic reef with lower and deeper sections would have retained channels that would have been difficult to wade through. In addition, Drews and Han were skeptical that refugees could have crossed during nearly hurricane-force winds.
— NCAR & UCAR News Center (2010): Parting the waters: Computer modeling applies physics to Red Sea escape route.
NPR’s article on the topic is worth a listen.
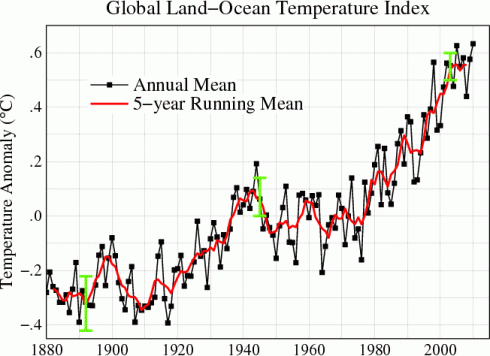
NASA’s Goddard Institute for Space Science has an excellent page that is updated every month, which shows graphs of global temperature changes.
IN addition to the global graphs, there are a lot of really neat graphs showing:
The graphs typically show the temperature anomaly, which is the difference in temperature from the normal. The “normal” is taken to be the average temperature between 1951 and 1980.
First off, three cheers for Viet Hoa, the Vietnamese food market on Cleveland Ave in Memphis. I’ve been searching for a source of fresh, uneviscerated, marine fish in this mid-continental city for quite a while, and I’ve finally found them. The market was the source of the subjects of an excellent anatomy lesson, and a delicious dinner.
I’d grabbed three fish, and a few goodies, and packed them on ice on the day before our trip. The large red snapper was a little pricey because it was fairly big, but I knew it would be quite tasty and I was hoping the internal organs would be big and clearly visible. The milk fish was an unknown, but it was big and cheap so worth experimenting on. The last fish was the smallest, and I’m not quite sure what kind it is, except that it’s marine. I’d tried one at home the previous week and found that while it had an excellent taste, the internal bits were on the small side.
On the first night of the immersion I started with the biggest fish, the red snapper, with everyone around the table. I’m happy to say that all my students were there for the lesson, facing the table, even the more vegetarian minded. I’ve always believed that there is a certain, necessary, ethic to knowing where your food comes from, and what went into preparing it for you. If you’re going to eat meat, you should be able to spare a moment to think about the animal.
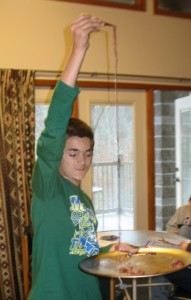
The digestive system was the easiest to identify and trace. The mouth and anus are pretty obvious on the outside. After cutting through the skin of the belly, you can follow the intestines from the anus all the way to the stomach. The intestines are quite long.
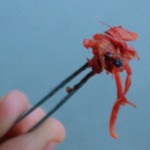
We found two partially digested, shrimp-like creatures in the stomach of the red snapper.
From the other end of the digestive system, once you get all the contents out of the body cavity, you can stick a probe through the mouth (watch out for sharp teeth) down through the esophagus to the stomach.
Pulling back the gills, you can see all the way through to the mouth. One student noticed how bright red the gills were, so we talked about oxygenation of blood and compared the fish’s gills to the human respiratory system.
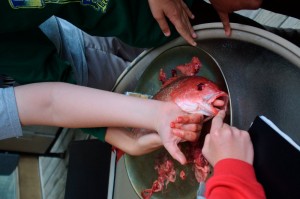
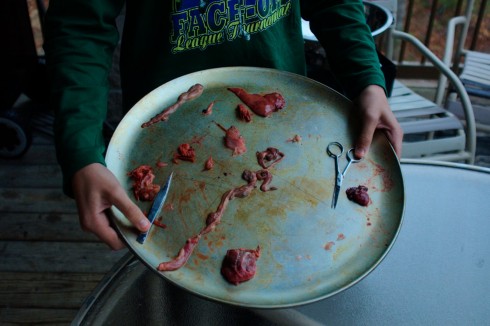
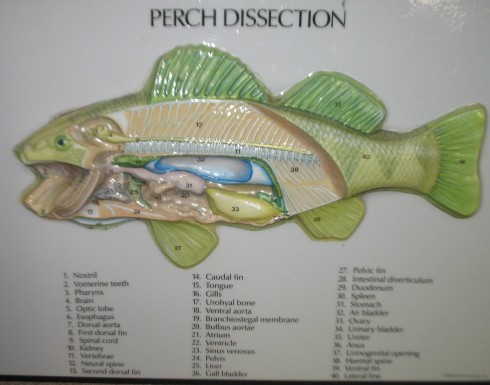
Judging from the fish anatomy diagram on the La Crosse Fish Health Center website, we found the air bladder (tucked in the center right next to the spine), the liver, the kidneys, and probably the heart. We pulled them out and photographed them.
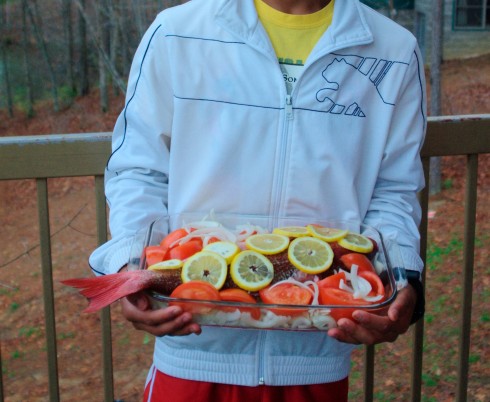
Finally, I laid the fish on a bed of thinly sliced onions, surrounded it with wedges of tomato (seeded), covered it with lemon slices, dribbled a tablespoon of olive oil on top, and forgot to add the cup of white wine (which we did not seem to have on hand for some reason) and the bay leaf. It was a big fish so we ended up baking it for about 40 minutes at 400 degrees Fahrenheit.
Then we ate it. I say we, but it really was just a couple of students and myself who did most of the eating, although I believe I convinced everyone to at least try it. Of the more serious students of anatomy, the eyeballs were highly prized; with only three fish we did not have enough to go around.
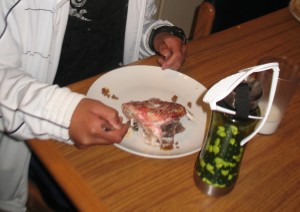
By the time we were done with dinner the skeletal system was very nicely exposed.
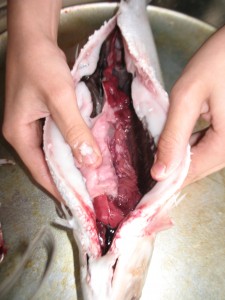
A couple of my students did the honors of cleaning the other two fish. With its large organs, the milk fish was an excellent subject for dissection, but it was not particularly palatable. We did however find the gall bladder.
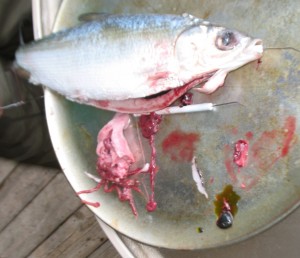
Even the smallest fish proved a worthwhile subject for the more patient student.
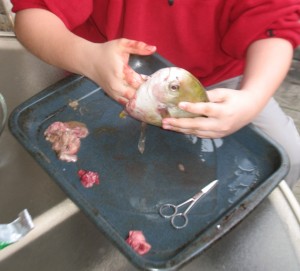
Instead of eating the rather unappetizing, baked milk fish I combined it in a soup with some clams I’d picked up from Viet Hoa. I’d grabbed the clams so we compare modern bivalve shells to the cretaceous ones we’d find at Coon Creek. A bit of boiling with a few herbs, made for an excellent broth the following night.
Cleaning fish for an anatomy lesson worked very well. As we excavated each internal organ, we could talk about what it did, why the fish needed it, and what was its analogue in humans. And, in the end, they made for a couple excellent meals.
P.S. – From the Gulf Coast Research Lab’s Marine Education Center, here’s a reference image for a perch dissection.
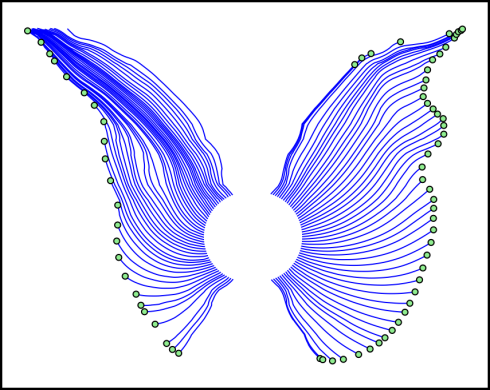
I’ve been helping my wife model the fluid flow through her apparatus, and she has some really neat results from some experiments where two chemicals react and block off the regular, symmetrical flow.
The streamlines look a bit like butterfly wings to me, so I modified the image a little. The original flow paths through the circular apparatus are below. I’m not sure which image I like better.
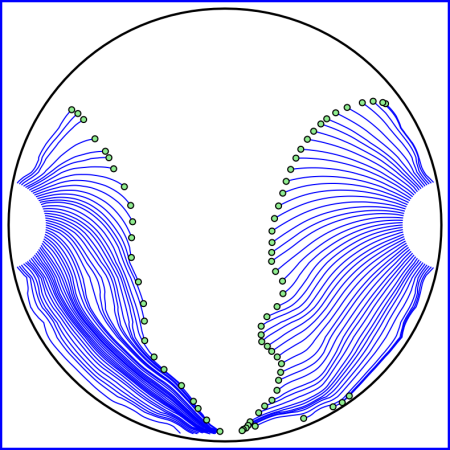
P.S. The other thing I learned from this little exercise is how to write Scalable Vector Graphics (svg) files (W3C has an excellent reference). With svg’s, like other vector graphics formats, no matter how big you blow them up you never loose resolution like you would do with a regular, rasterized image. Unfortunately, I still have to figure out how to include the svg files on this blog, so these png images will have to do for now.