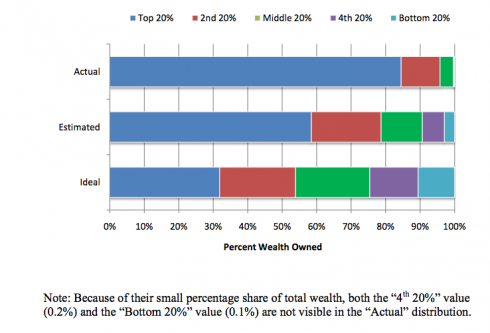
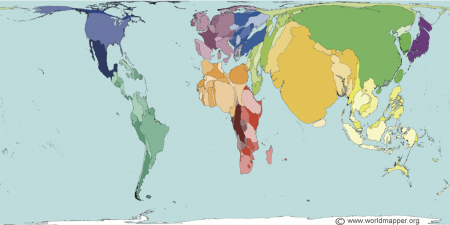
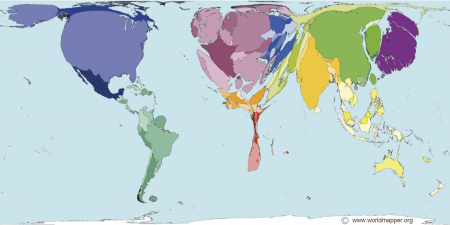
Using the actual U.S. wealth distribution data from Norton and Arieli (2011; pdf), I created a little addendum to our exercise on the distribution of wealth.
I started with the definition of wealth. Students tend to think you’re referring to annual income, so I gave the example of someone who does not have a job but owns a house; they have no income but some wealth in the value of the house. Alternately, someone who has $2 million in the bank, but owes $4 million, actually has negative wealth.
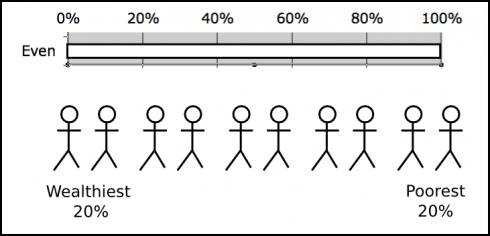
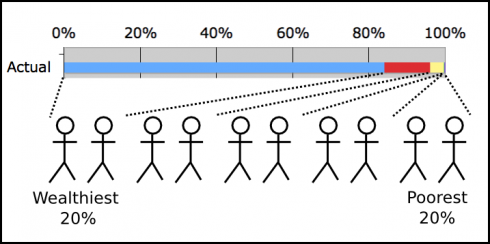
Then I drew a little stick figure diagram to represent the population of the United States. With ten figures, paired up, that gives five parts, aka quintiles.
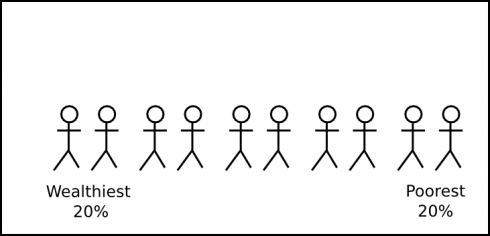
Students were then presented with an empty bar graph and asked, “How much of the U.S.’s wealth is owned by the wealthiest 20% of the population?” Instead of asking in percentages (as are shown in the graph), I asked them to assume that the total wealth in the U.S. is $100 trillion.
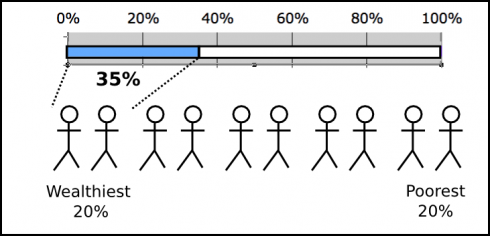
The first suggestion was $35 trillion, which is shown below. Others offered different amounts, ranging up to $50 trillion. Someone even suggested $15 trillion, which is not possible, since that would mean that the wealthiest 20% have less than 20% of the total wealth of the country.
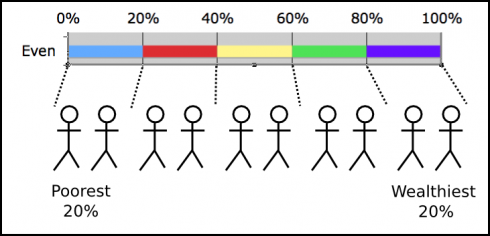
Once they got the idea, I showed them what the graph would look like in an idealized socialist country, where everyone had the same wealth.
Finally, I asked my students to fill in what they believed to be the actual case for the U.S. for all five quintiles. The results had to add up to $100 trillion. They gave me their numbers individually before we broke up our meeting, and I entered it in the U.S. distribution of wealth spreadsheet to produce a graph.
After lunch, I showed them the results.
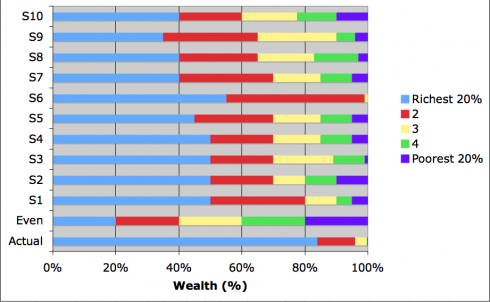
For dramatic effect, I hid the last two bars at first. We talked over their numbers, then I showed them the equal distribution case (which they’d seen before), and finally the actual distribution.
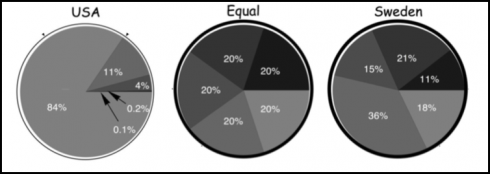
The response was salutary; a moment of surprised silence and then whispers. What then followed was a nice, short discussion. I pointed out the pie charts showing the U.S. versus an equal distribution, versus Sweden and asked what they would do, if they were an autocratic monarch, or if they were the president to make the U.S.’s distribution more equal.
We talked about the government just taking private property, like the communists did. Then we talked about progressive taxation. We ended by talking about the estate tax, and meritocracy, which we’d touched on in the morning.
I thought the exercise worked very well. Not only did we get into an interesting economic issue, but got some practice with math and interpreting graphs too.

