KCL: Current flow into a node must equal the flow out of the node. (A node is a point on the wire connecting components in a circuit–usually a junction).
(KCL: Kirchoff’s Current Law) Current flowing into any point on a circuit is equal to the current flowing out of it, A simple circuit with a voltage source (like a battery) and a resistor.
KVC: The sum of all the voltage differences in a closed loop is zero.
KVL: The voltage difference across the battery (9 Volts) plus the voltage difference across the resistor (-9 Volts) is equal to zero.
Things get more interesting when we get away from simple circuits.
Current flow into a node (10 A) equals the flow out of the node (7 A + 3 A).
Note that the convention for drawing diagrams is that the current move from positive (+) to negative (-) terminals in a battery. This is opposite the actual flow of electrons in a typical wired circuit because the current is a measure of the movement of negatively charged electrons, but is used for historical reasons.
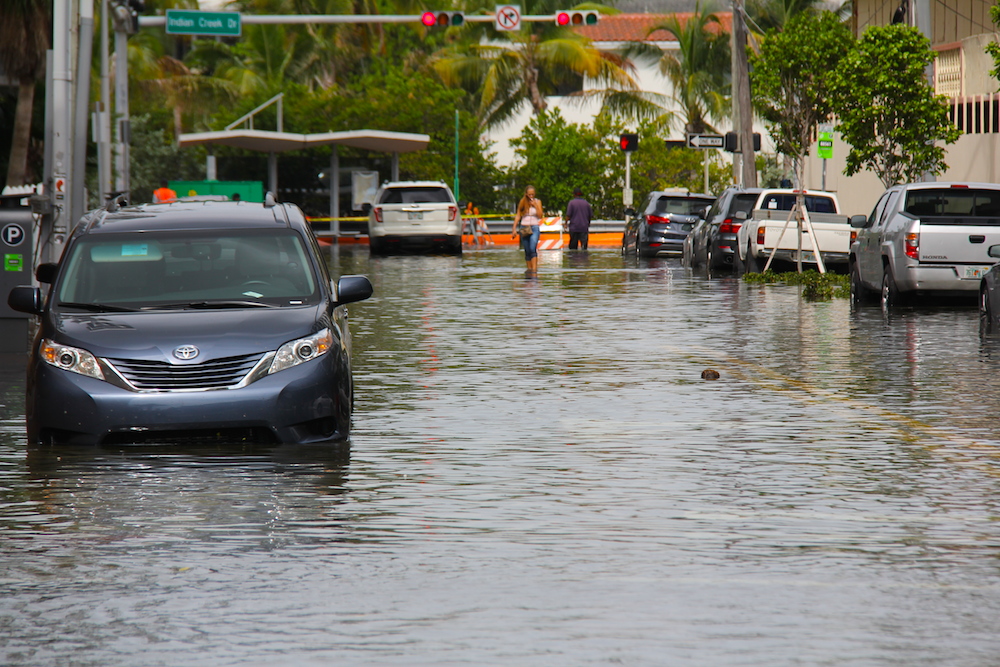
The Siege of Miami: A detailed report that looks at the increasing frequency of flooding in Miami, because of sea-level-rise. The reporter interviews a number of scientists and engineers who are not terribly optimistic about the long-term (50+ years) future of many Floridian cities because of the melting ice-caps in Greenland and Antarctica.
Flooded street during a “King Tide” in Miami Beach, Florida. Image from NOAA.
The last sub-atomic particle discovered was the Higgs boson, which is shown in the graph below.
Finding the Higgs Boson “The strongest evidence for this new particle comes from analysis of events containing two photons. The smooth dotted line traces the measured background from known processes. The solid line traces a statistical fit to the signal plus background. The new particle appears as the excess around 126.5 GeV. The full analysis concludes that the probability of such a peak is three chances in a million. ” from ATLAS.
A quick program that animates scaling (dilation) of shapes by scaling the coordinates. You type in the dilation factor.
dilation.py
from visual import *

#axes
xmin = -10.
xmax = 10.
ymin = -10.
ymax = 10.
xaxis = curve(pos=[(xmin,0),(xmax,0)])
yaxis = curve(pos=[(0,ymin),(0,ymax)])

#tick marks
tic_dx = 1.0
tic_h = .5
for i in arange(xmin,xmax+tic_dx,tic_dx):
    tic = curve(pos=[(i,-0.5*tic_h),(i,0.5*tic_h)])
for i in arange(ymin,ymax+tic_dx,tic_dx):
    tic = curve(pos=[(-0.5*tic_h,i),(0.5*tic_h,i)])

#stop scene from zooming out too far when the curve is drawn
scene.autoscale = False

# define curve here
shape = curve(pos=[(-1,2), (5,3), (4,-1), (-1,-1)])

shape.append(pos=shape.pos[0])
shape.color = color.yellow
shape.radius = 0.1
shape.visible = True

#dilated shape
dshape = curve(color=color.green, radius=shape.radius*0.9)
for i in shape.pos:
    dshape.append(pos=i)

#label
note = label(pos=(5,-8),text="Dilation: 1.0", box=False)
intext = label(pos=(5,-9),text="> x", box=False)

#scaling lines
l_scaling = False
slines = []
for i in range(len(shape.pos)):
    slines.append(curve(radius=shape.radius*.5,color=color.red, pos=[shape.pos[i],shape.pos[i],shape.pos[i]]))


#animation parameters
animation_time = 1. #seconds
animation_smootheness = 30
animation_rate = animation_smootheness / animation_time

x = ""
while 1:
    #x = raw_input("Enter Dilation: ")
    if scene.kb.keys: # event waiting to be processed?
        s = scene.kb.getkey() # get keyboard info

        #print s
        if s <> '\n':
            x += s
            intext.text = "> x "+x
        else:
            try:
                xfloat = float(x)
                note.text = "Dilation: " + x

                endpoints = []
                dp = []
                for i in shape.pos:
                    endpoints.append(float(x) * i)
                    dp.append((endpoints[-1]-i)/animation_smootheness)
                #print "endpoints: ", endpoints
                #print "dp:        ", dp
                for i in range(animation_smootheness):
                    for j in range(len(dshape.pos)):
                        dshape.pos[j] = i*dp[j]+shape.pos[j]
                    rate(animation_smootheness)
                    if slines:
                        for i in range(len(shape.pos)):
                            slines[i].pos[1] = vector(0,0)
                            slines[i].pos[-1] = dshape.pos[i]

                for i in range(len(shape.pos)):
                    dshape.pos[i] = endpoints[i]
                    slines[i].pos[-1] = dshape.pos[i]

                for i in range(len(shape.pos)-1):
                    print shape.pos[i], "--->", dshape.pos[i]

            except:
                #print "FAIL"
                failed = True
                intext.text = "> x "
            x = ""
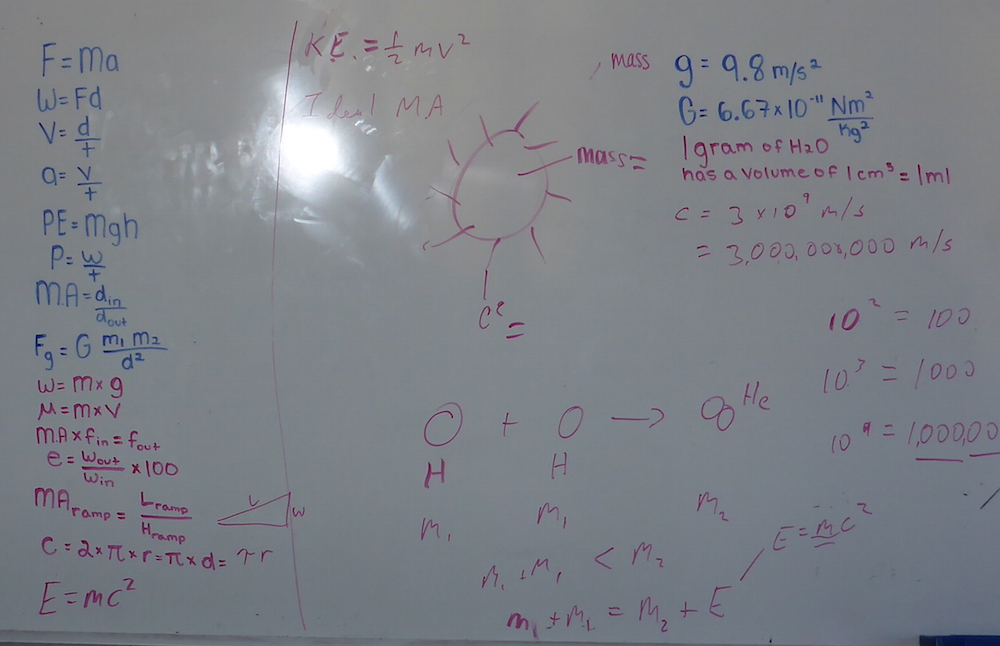
Part of physical science for the middle school is to start going beyond the conceptual, and making the connection between equations in science and algebra. So, we’ve started making note cards for the numerous laws we’ve encountered so far.
For the student who asked how do we know about black holes if we can’t see them. From NASA. Based on the paper: http://www.nasa.gov/mission_pages/chandra/destroyed-star-rains-onto-black-hole-winds-blow-it-back.html
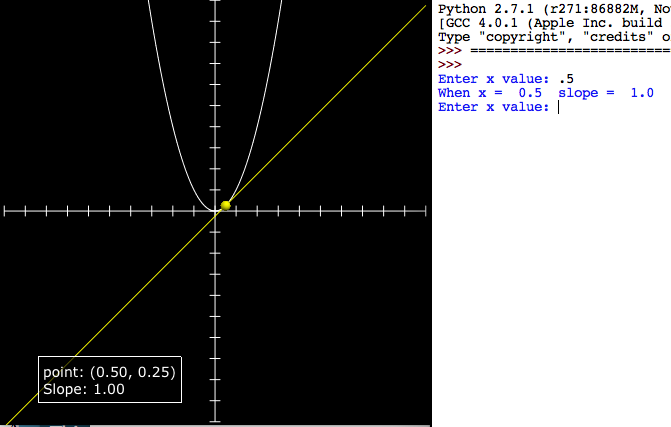
Screen capture: Enter an x value and the program calculates the slope for the function and draws the tangent line.
This quick program is intended to introduce differentiation as a way of finding the slope of a line. Students know how to find the slope of a tangent line at least conceptually (by drawing). We pick a curve: in this case:
then enter values of x in the program to see how x, the function value and the differential compare to each other.
x
f(x)
f'(x)
0.5
0.25
1
1
1
2
2
2
4
3
9
6
Because it’s quick you have to change the function in the code, and enter the values for x in the python shell.
With a sin curve.
differentiation_intro_numeric.py
from visual import *

class tangent_line:
    def __init__(self):
        self.dx = 0.1
        self.line = curve()
        self.tangent_line = curve()
        self.point = sphere(radius=.25,color=color.yellow)
        self.point.visible = False
        self.label = label(pos=(-5,-8))

    '''CHANGE FUNCTION (y) HERE'''
    # the original function
    def f(self, x):
        #y = sin(x)
        y = x**2
        return y
    '''END CHANGE FUNCTION HERE'''

    def find_slope(self, x):
        sdx = .00001
        m = (self.f(x+sdx)-self.f(x))/sdx
        return round(m,3)

    def draw(self):
        for x in arange(xmin, xmax+self.dx, self.dx):
            self.line.append(pos=(x, self.f(x)))

    def draw_tangent(self, x):
        m = self.find_slope(x)
        y = self.f(x)
        b = y - m * x
        print "When x = ", x, " slope = ", m
        self.label.text = "point: (%1.2f, %1.2f)\nSlope: %1.2f" % (x,y,m)
        self.plot_point(x)

        #draw tangent
        self.tangent_line.visible = False
        self.tangent_line = curve(pos=[(xmin,m*xmin+b),(xmax,m*xmax+b)], color=color.yellow)

    def plot_point(self, x):
        self.point.visible = True
        self.point.pos = (x, self.f(x))

#axes
xmin = -10.
xmax = 10.
ymin = -10.
ymax = 10.
xaxis = curve(pos=[(xmin,0),(xmax,0)])
yaxis = curve(pos=[(0,ymin),(0,ymax)])

#tick marks
tic_dx = 1.0
tic_h = .5
for i in arange(xmin,xmax+tic_dx,tic_dx):
    tic = curve(pos=[(i,-0.5*tic_h),(i,0.5*tic_h)])
for i in arange(ymin,ymax+tic_dx,tic_dx):
    tic = curve(pos=[(-0.5*tic_h,i),(0.5*tic_h,i)])

#stop scene from zooming out too far when the curve is drawn
scene.autoscale = False

# draw curve
func = tangent_line()
func.draw()

# get input
while 1:
    xin = raw_input("Enter x value: ")
    func.draw_tangent(float(xin))