We had a really nice, thoughtful seminar discussion in Algebra II, with the simple question: What is real?
I did this as a lead into the topic of imaginary numbers ().
The distinction between tangible and intangible objects came up pretty early in the discussion. That morphed pretty quickly with the realization that there were things that you can’t touch, like ideas and thoughts that were real as well, despite being non-physical.
Then they considered some of the more edge-wise cases, such as, are dragons real. After all, they never really existed, but are parts or real myths. That thought lead to the idea that anything that was thinkable–anything you could think of–was real.
I jumped in, near the end, to insert the idea that maybe there were things that were not real–that were imaginary–but could be useful. And that’s how I set up my lesson on imaginary numbers.
Because even if you can’t calculate the square root of -1 (no number times itself will give a negative number).
You can give it a name.
And under certain circumstances:
You might find that imaginary numbers can combine to give you real numbers.
Which means we can do a whole lot of calculations that were impossible before, making imaginary numbers extremely useful.
This September a TechShop branch opened up in St. Louis. I’ve been aware of these neat Makerspaces for a few years now, so it was a pleasant surprise when one turned up in town. Even more surprising (and just as pleasant) was that a parent at our school, who was so excited by the opportunities that a place like the TechShop would offer to a school that tries to emphasize hands-on, experiential education, donated four memberships to the school–one for a faculty member and three for students.
Since there are some age restrictions on which machines minors can use–a lot of the woodshop is off limits until they’re 16 and even then adult supervision is required, I arranged a small application for the student memberships that was only open to middle and high-schoolers. Based on the response I got back, we split the annual memberships by semester, so we have three students using it this fall and three more will have access to them in the spring.
The way the TechShop works is that they have a wide range of equipment under one roof and once you take a safety and basic usage (SBU) class on the particular machine you want to use you can reserve time on the machines. There’s a wood shop with saws, sanders, a lathe, and a CNC machine; a metal shop with the same; a set of 3d printers; a set of laser cutters/etchers; a fabric shop with some serious sowing machines, including one that is computer controlled; an electronics shop; a plastics work area with vacuum forming and injection molding machines. They also do a set of interesting classes on using the design software and some interesting projects that can take advantage of the tools available–I have my eye on the Coptic Bookbinding, and the Wooden Bowl making classes. Finally, they’re set up with classrooms where you can bring students in for small STEAM classes, which includes things like using Arduinos.
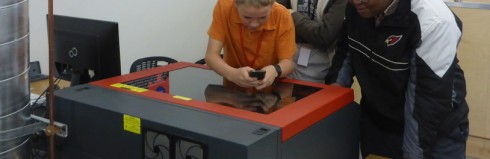
Students etching an anodized aluminum luggage tag during their SBU class on the laser cutter/etcher.
So far, we’ve all taken the Laser class, and there’s just so much that you can do with the laser that we’ve been spending a lot of time experimenting. The students have been etching signs–including a grave marker for our goat MJ who recently passed away–as well as pictures, luggage tags, and making presents. Since this is a machine that the older students can use independently I’ve lost track of everything they’ve been doing.
I’ve also taken the woodshop wood CNC class, so my own experiments have been a bit more expansive, including making dry-erase erasers, floor-holders for quivers for the archery program, simple chemistry molecular model sets (just 2d), boxes for Ms. Fu’s math cards, and I’m trying to figure out how to make a clock.
There’s been a push for students to take algebra earlier and earlier, yet there are some serious pedagogic arguments that early algebra might not be a great idea for many, if not most, students. A fascinating paper by Clotfelter et al., (2012) (pdf) showed pretty clearly that for a large number of students, taking algebra earlier actually resulted in worse performance in not just algebra, but the follow-up classes as well (geometry and pre-calculus for example), compared to students who waited to take the subject. Indeed the Charlotte-Mecklenburg School District (the district studied in the article) actually reversed their policy of having students take algebra in 8th grade.
Students affected by the acceleration initiative scored significantly lower on end-of-course tests in Algebra I, and were either no more likely or significantly less likely to pass standard follow-up courses, Geometry and Algebra II
The argument for early algebra comes from the correlation between early algebra and better performance on standardized tests, and more advanced math classes in high school. But the authors here indicate that forcing students to take algebra early does not result in the same outcomes.
The argument against early algebra is based on the research that shows formal thinking develops during adolescence, and the belief that to do well in algebra requires the abstract thinking skills that are seated in the maturing prefrontal cortex. Until students are ready for the abstract thinking required (which happens at different times for each student), they will struggle with algebra.
Algebra provides an essential foundation for further mathematics, which is why it is my strong preference that students progress by demonstrating mastery of the topics at their own pace rather than struggling through the class.
Manuel Lima contrasts the traditional, hierarchical, view of the world (evolution’s tree of life for example) to a more network oriented perspective.
One interesting part is the interpretation of the history of science as having three phases, dealing with Problems of:
Simplicity: Early scientific efforts (17th-19th centuries) was focused on “simple” models of cause and effect — embodied perhaps in Newton’s Laws, where every force has an equal and opposite force.
Disorganized Complexity: Think early 20th century nuclear physics — Heisenberg’s uncertainty principle for example — where the connections between events are complicated and sort of random/probabilistic.
Organized Complexity: Systems science sees the interrelatedness of everything: ecologic food webs; the Internet; horizontal gene transfer across the limbs of the tree of life.
Some people can hear with their eyes. It’s called synesthesia, and it happens when the different sensory systems get crossed. A new app, Sonified, lets you experience it, as the video below demonstrates.
A series of still photographs of a projectile (soccer ball) in motion were used to determine the equation for the height of the ball (h(t) = 4.9 t2 + 14.2 t + 1.25), the initial velocity of the ball (14.2 m), the maximum height of the ball (11.6 m), and the time between each photograph (0.41 s). The problem was solved numerically using MS Excel’s Solver function. There are much easier ways of doing this, which we did not do.
Introduction
Figure 1. Calculated elevation of the soccer ball after launch.
Figure 2. Animation of the soccer ball projectile.
One of physics lab assignments I gave my students was to see if students could use a camera to capture a sequence of images of a projectile, plot the elevation of the projectile from the photographs, determine the constants in the parabolic equation for the height of the projectile, and, in so doing, determine the velocity at which the projectile was launched.
I offered my old, digital Pentax SLR that can take up to seven pictures in quick sequence and be set to fully manual. A digital video camera with a detailed timestamp would have been ideal, but we did not have one available at the time.
Now the easy way of getting the velocity data would be to estimate the heights (h) of the ball from the image using some sort of known reference (in this case the whiteboard), and determine the time between each photograph (Δt) by photographing a stopwatch using the same shutterspeed settings. After all, the average velocity of the ball between two images would be:
The reference whiteboard is four feet tall (1.22 m) in real life, but 51 pixels tall in the image. Using this ratio (i.e. 1.22 m = 51 px) we can convert the heights of the ball from pixels to meters:
Table 1. Table showing the conversion of the height of the ball in pixels to elevation (in meters).
Unfortunately, I think my students forgot to do the pictures of the stopwatch to get Δt, the time between each photograph. Since the lab reports are due on Monday, and it’s the weekend now I’m curious to see what they come up with.
However, I was wondering if they could use just the elevation data to back out the Δt. So I gave it a try myself. Even the easiest way of solving this problem is not trivial, in fact, I ended up resorting to Excel’s iterative solver to find the answers. While this procedure probably goes a little beyond what I expect from the typical high school physics student, more advanced students who are taking calculus might benefit.
Procedure
We took the reference whiteboard (1.21 m tall), a soccer ball, and the camera outside. The whiteboard was leant vertically against the post of the soccer goal. The ball was thrown vertically by a student standing next to the whiteboard (see Figure 1) while pictures were taken. The camera’s shutterspeed was 1/250th of a second. The distance from the camera to the person throwing the ball (and to the whiteboard) were not measured.
The procedure was repeated several times, but only one trail was used in this analysis.
The images were loaded onto a computer, and the program GIMP was used to determine the distance, in pixels, from the ground to the projectile. The size of the reference whiteboard, in pixels, was used to calculate the height of the soccer ball in meters.
The elevations measured off the photographs were then used to calculate the release velocity, time between snapshots, and maximum height of the ball.
The Equation for Elevation
I started with the fact that once the ball is released, the only force acting on it is the force of gravity. Since the mass of the ball does not change we only have to consider the acceleration due to gravity (-9.8 m/s2). I also neglect air resistance to make things easier.
Finding the Velocity Equation
Start with the fact that, acceleration is the rate of change of velocity with time. You can write it in the differential form:
so we integrate with respect to time to get the equation for velocity as a function of time:
where c is an unknown constant. What we do know though, is that at the beginning, when the ball is just launched, time is zero (t = 0) so cv becomes the initial velocity (v0) at which the ball is thrown:
at t = 0, v(0) = v0:
So our velocity equation becomes:
Finding the height equation
Now since we know that velocity is the rate of change of distance (in this case height) with time:
so we integrate again to find the height equation:
Similar to what we did with the velocity equation, to find the new constant c we consider what happens at the start time, when the ball is launched, and t = 0 and h(0) = h0;
so:
The constant is equal to the initial height of the ball — the height of the ball when it’s thrown. So we end up with the final equation:
Results
Solving all the unknowns
At this point, although we have an equation for the height of the ball, we don’t know the initial velocity (v0), nor do we know the initial height of the ball when it’s released (h0). And we still don’t know the time when the ball is at each position.
With that many unknowns we’d need the same number of independent equations to be able to solve for them all. It may be possible, but instead of analytically solving the equations I opted to take a numerical approach, and use Excel’s Solver function.
I started by setting up the equations to calculate the height of the ball at six different times to correspond with our six height measurements. It was necessary therefore to create a set of variables:
Time when we started taking pictures (t1): Since we don’t know how long after we threw the ball we started taking pictures, I made this a variable called t1.
The time between each picture (dt): I made the assumption that the time between each picture would be constant. The shutter speed was constant (1/250th of a second) so there is no obvious reason why the time should be different.
Initial velocity (v0): The initial upward speed at which the ball was thrown. Obviously, the faster the initial speed the higher the ball goes, so this is a fairly important parameter.
Initial height (h0): We also don’t precisely know how high the ball was when it was released, so this also needs to be a variable.
By defining the time between each picture as dt, we can write the time that each picture was taken in terms of the time of the initial picture (t1) and dt. After all the second picture would have been taken dt seconds after the first for a total time of:
similarly for all the pictures:
Table 2. Table of expressions giving the time when each of the six photos were taken.
Now I set up an Excel spreadsheet and gave all the unknown variable values and initial value of 1:
Table 3. Table in Excel for determining the height of a projectile. All of the unknown variables' values are highlighted in green and have been given an initial value of 1.
Now I just had to run Solver and tell it that I wanted the Total Residual, which gives the difference between the h(1) equation’s values for height and the actual, measured values, to be as close to zero as possible. A perfect fit of the equation to the data would have a total residual of one, but that’s not possible when you’re dealing with real data.
Table 4. Parameters set in Solver to determine the values of the unknown constants.
Even so, I had to goose Solver a bit for it to produce reasonable numbers. I put in a few constraints:
dt >= 0: We could not have a negative time between pictures.
h0 <= 1.25: 1.25 meters seemed reasonable for the height at which the ball was released.
t1 <= 1: It also seemed reasonable that the time when the first picture was taken was less than one second after the ball was thrown.
I ran the Solver a few times, and had to reset dt to 0.5 at one point when it had become zero, but the final result looked remarkably good: the total difference between the modeled line and the actual data was only 0.113 meters.
Table 5. Solver's solution for the unknown constants in the height equation.
So we found that:
Initial velocity: v0 = 14.2 m/s
Height at release: h0 = 1.25 m
Time between pictures: dt = 0.41 s
Time when the first picture was taken: t1 = 0.44 s
Which makes the height equation:
Using these constants in the height equation, we could see how good fit the height equation was to the data:
Figure 3. Graph comparing the modeled heights (from the h(t) equation) to the actual data.
Maximum Height of the Ball
Finally, the maximum height of the ball can be read off the graph, but it can also be determined using the equation for the height of the ball:
We know that the maximum height is reached when the ball stops moving upward and starts to descend. At that point, the vertical velocity of the ball is zero. Since the velocity of the ball is the rate of change of height () we can differentiate the height equation to get an equation for velocity.
since we’ve determined that the initial velocity of the ball is 14.2 m/s we get:
when the velocity is zero (v = 0):
which can be solved for t to find that the time the ball reaches it’s maximum height is:
Putting this into the height equation:
gives:
Discussion
I’m quite happy with the way this project turned out. The fit between the modeled heights (h(t)) and the actual heights was very good.
My primary concern going into the project was that the distortion from the camera lens would make this technique impossible, but that appears not to be a significant problem.
Most of this calculation, including the somewhat tricky numerical solution using Solver could have been avoided if I’d calibrated the camera, simply by pointing it at a stopwatch (using the same shutterspeed as in the experiment) and measuring the time between snapshots. It will therefore be interesting to see if the actual time between shots (dt) is close to the dt of 0.41 seconds calculated by the model.
Finally, as noted above, a video camera with a timestamp would possibly be a more useful technology for this experiment.
Conclusion
It is possible to analyze the projectile path of an object using a series of snapshots, to determine the initial velocity of the projectile, its release height, and the time between snapshots, if you can assume that the time between snapshots is identical. There are, however, much easier methods of solving this problem.
 ).
). 


 ) we can differentiate the height equation to get an equation for velocity.


