Guest post by Grace Appell.
What is a Boxplot?
A box plot is a graph that helps you to analyze a set of data. It used to show the spread of the data. In it you use five data points: the minimum, the 1st quartile, the median, the 3rd quartile, and the maximum.
The minimum is the lowest point in your data set, and the maximum is the largest. The median is the number in the middle of the data set when you have the number lined up numerically.
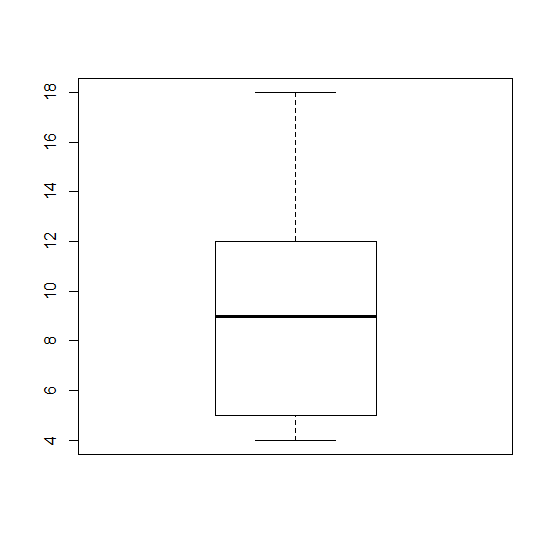
For example if your data set was this:
5, 6 ,11, 18, 12, 9, 4
First you would put them in order lowest to highest.
4, 5, 6, 9, 11, 12, 18
Your median would be 9, because it is the middle number. The minimum would be 4, and the maximum would be 18.
The first quartile would be 5, the median of the numbers below 9, and the third quartile would be 12, the median of the numbers above 9.
So the data you would use in your boxplot would be
(4,5,9,12,18)
The boxplot would look like would look like this.
What is R?
R is a software program that is free to download that you can use for calculating statistics and creating graphics.
Here is their website: https://www.r-project.org/
Boxplots in R
In R you can create a boxplot by using this formula.
> Name of data set <- c(minimum, quartile 1, median, quartile 3, maximum)
> boxplot(Name of data set)
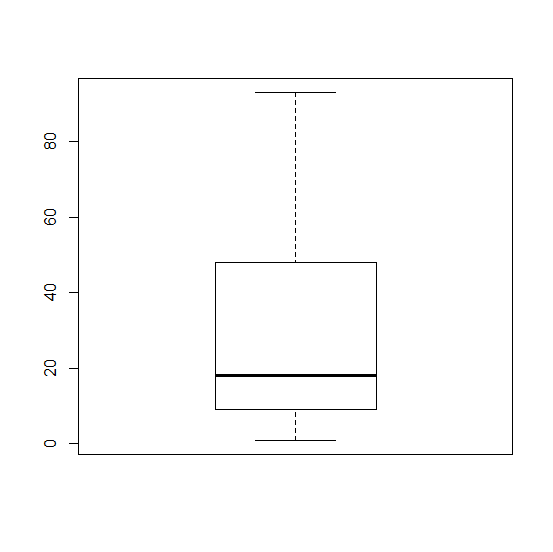
First you have to name your data set. In our project where we analyzed the number of times people repeated their Shakespeare lines that they performed, I used the name Macbeth. So the formula looked like this:
> Macbeth <- c(1,9,18,48,93)
> boxplot(Macbeth)
Using this data set, your box plot should look like this