DNA Visualization

Screen capture from R.M's code.
Screen capture from R.M’s code.

Another interesting project that came out of the Creativity Interim was a VPython program that uses the DNA Writer translation table to convert text into a DNA sequence that is represented as a series of colored spheres in a helix.

The code, by R.M. with some help from myself, is below. It’s pretty rough but works.

dna_translator.py

from visual import *
import string

xaxis = curve(pos=[(0,0),(10,0)])

inp = raw_input("enter text: ")
inp = inp.upper()


t_table={}


t_table['0']="ATA"
t_table['1']="TCT"
t_table['2']="GCG"
t_table['3']="GTG"
t_table['4']="AGA"
t_table['5']="CGC"
t_table['6']="ATT"
t_table['7']="ACC"
t_table['8']="AGG"
t_table['9']="CAA"
t_table['start']="TTG"
t_table['stop']="TAA"
t_table['A']="ACT"
t_table['B']="CAT"
t_table['C']="TCA"
t_table['D']="TAC"
t_table['E']="CTA"
t_table['F']="GCT"
t_table['G']="GTC"
t_table['H']="CGT"
t_table['I']="CTG"
t_table['J']="TGC"
t_table['K']="TCG"
t_table['L']="ATC"
t_table['M']="ACA"
t_table['N']="CTC"
t_table['O']="TGT"
t_table['P']="GAG"
t_table['Q']="TAT"
t_table['R']="CAC"
t_table['S']="TGA"
t_table['T']="TAG"
t_table['U']="GAT"
t_table['V']="GTA"
t_table['W']="ATG"
t_table['X']="AGT"
t_table['Y']="GAC"
t_table['Z']="GCA"
t_table[' ']="AGC"
t_table['.']="ACG"

dna=""

for i in inp:
    
    dna=dna+t_table[i]
print dna

m=0
r=3.0
f=0.5
n=0.0
dn=1.5


start_pos = 1
for i in dna:
    rate(10)
    n+=dn
    m+=1
    x = n
    y=r*sin(f*n)
    z=r*cos(f*n)
    a=sphere(pos=(x,y,z))
    #print x, y, z
    if (i == "A"):
        a.color=color.blue
    elif (i== "G"):
        a.color=color.red
    elif (i== "C"):
        a.color=color.green
Mars Colonization Project

My high-school biology class is taking their exam on genetics and evolution. To make the test a little more interesting, and to point out that there may be some relevance for this knowledge in the future, I made the test a questionnaire for the new head of the Mars Colonization Project. It begins like this:

Friday, January 30th, 2054.

Dear Dr. ________________ (insert your name here):

We are excited that you have accepted our offer to head the Biomedical Division of the MCP. As we are engaged in the first ever effort to colonize another planet, we know that we will face many unique challenges. Your expertise in pluripotent stem cell research and oncology will be extremely valuable to us — even though some of us administrators still don’t know what pluripotent stem cells are.

Please fill out the questions in this document to help us with our planning for the colony and to help our Human Resources department assemble your research and medical team.

Because of the sensitivity of some of the personal information included in this document, please write out, and sign, the Honor Code below before turning the page.

Yours truly,

Board of Administrators,
Martian Colonization Project

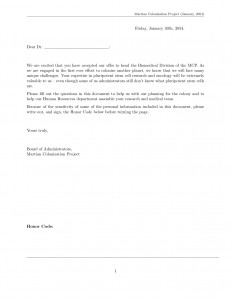
Front page of the High Schooler's Biology exam.
Front page of the High Schooler’s Biology exam.

Then I pose all of the questions in this context. For example, to get their knowledge of vocabulary I ask them to define the scientific words and phrases (which they’ve used in their scientific publications many, many times), in terms that laymen — like the people on the board of administrators — could understand.

To get at more complex concepts, like the molecular process of gene expression and regulation, I phrased the question like this:

Medical Issues Related to Ongoing Colonization Planning

The trip to Mars will take five years, so we will be placing most of the colonists into cryogenic sleep for most of that time. We are still working out some of the bugs in the cryogenic technology, and we need your help.

To put people into cryogenic sleep, we need to stop their digestion of carbohydrates. Your predecessor, Dr. Malign, told us that we could do this using RNA interference, by injecting them with engineered microRNA that would block the production of the enzyme amalyse.

Could you draw a diagram of a cell showing how proteins are expressed from DNA, and how microRNA would interfere with protein production. Are there other methods for preventing protein expression?

We’ll see how the students do on the test, however at least one student glanced at the front page and said, “This is kinda cool,” (actually, she first asked if I’d stolen the idea from the internet somewhere), which is significant praise coming from a teenager.

Using Soil pH as a Proxy for Ammonia Concentration

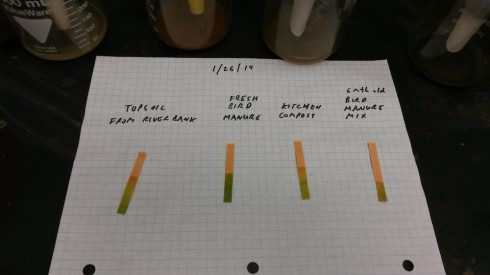
pH measurements from soil, bird manure, composted horse manure, and kitchen compost.

We’ve acquired a selection of manures and composts for revitalizing our orchard, but don’t quite know if they’re safe to add to the soil. Too much nitrogen in the manure will “burn” plants. Therefore, we tried a simple pH test as a quick-and-dirty proxy for estimating the nitrogen/ammonia concentration of the samples.

Since we’ve been working on the orchard, Dr. Sansone has contributed a pile of composted horse manure, a pile of composted kitchen scraps, and a pile of mixed compost and pigeon manure. You’re supposed to let bird manure compost for quite a while (months to years) before using it because of the high ammonia content that is produced by all the uric acid produced by birds.

The “burning” of the plants happens, primarily, when there’s too much ammonia in the manure. Ammonia becomes basic (alkaline) when dissolved in water (thanks to Dillon for looking that up for us). The ammonia (NH3) snags a hydrogen from a water molecule (H2O) making ammonium (NH4+) and hydroxide ions (OH).

NH3 + H2O <==> NH4+ + OH

The loose hydroxides make the water basic.

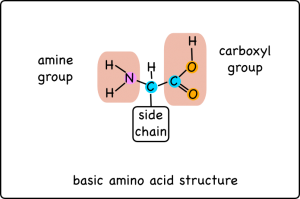
When excess amino acids are broken down the amine group becomes ammonia.

The ammonia, in this case, comes primarily from the breakdown of urea and uric acid in the manure. Animals produce urea (in the liver) from ammonia in the body. The ammonia in the body comes from the breakdown of excess amino acids in food. We get the amino acids from digestion of proteins (proteins are long chains of amino acids. The urea is excreted in urine, or in the case of birds as uric acid mixed in with their feces.

Experimental Procedure

  1. Weigh 100 g of soil/compost/manure.
  2. Add enough water to fill the beaker to the 300 ml level. Some of the samples absorbed significant amounts of water necessitating more water to get to the 300 ml level.
  3. Stir to thoroughly mix (and melt any ice in the soil) then let sit for 5 minutes.
  4. Pour mixture through filter (we used coffee filters).
  5. Test the pH of the filtrate (the liquid that’s passed through the filter) using pH test strips.

Important Note: We did the experiment under the hood, because the pigeon manure was quite pungent.

In addition to testing the manure and compost, we tried a soil sample from the creek bank, and a sample of fresh pigeon manure to serve as controls.

Results

The results were close to what we expected (see Table 1), with the bird manure having the highest pH.

Table 1: pH of soil, manure, and compost samples.

Sample pH
Topsoil from Creek Bank 6
Fresh Pigeon Manure 8-9
Kitchen Compost 5-6
6 Month Old Pigeon Manure/Compost Mix 6-7

Discussion/Conclusion

While the high pH of the fresh pigeon manure suggests that it probably too “hot” to directly apply, it was good to see that the composted manure had a pH much closer to neutral.

This is a simple way to test the soil, so it may be useful for students to do this as we get new types of fertilizer.

Drawing Faces: An Exercise in Heredity

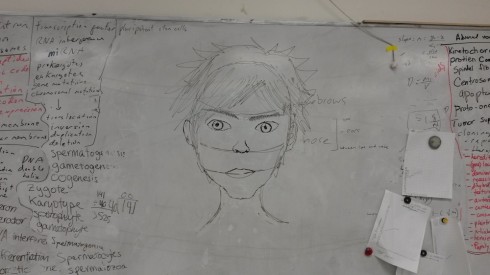
A.C.'s demonstration of how to draw a face.
A.C.’s demonstration of how to draw a face.

My biology students are doing an exercise in genetics and heredity that requires them to combine the genes of two parents to see what their offspring might look like. They do the procedure twice — to create two kids — so they can see how the same parents can produce children who look similar but have distinct differences. To actually see what the kids look like, the students have to draw the faces of their “children”.

“I’m not going to claim that child as my own!”

I was walking through the class when I heard that. Apparently one student, who’d had a bit of art training, was paired with another student who had not.

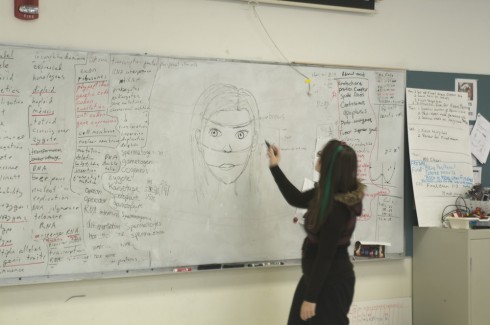
Fortunately, I was able to convince the more practiced artist to give the rest of the class a lesson on how to draw faces. She did an awesome job; first drawing a female face and then adapting it a bit to make it look more male.

If nothing else, I tried to make sure that the other students registered the idea that proportion is important in drawing biological specimens — like faces — from real life. Just getting the proportions right made a huge difference in the quality of their drawings. The forehead region should be the largest (from the top of the head to the eyebrows), then the area between the eyebrows and the bottom of the nose, then the nose to lips, and then, finally, the region from lips to chin should be shortest. You can see the proportion lines in the picture above.

The adaptation stage, where she made the facial features more masculine, was also quite useful. The students had to think about what were typical male features and if there were a genetic basis to things like square chins.

Although all of the other students’ drawings improved markedly, including her simulated spouse’s, I don’t think my art-teaching student was absolutely happy with the end results after the one lesson. She ended up handing in two drawings of her own even though everyone else (including her partner) did one each.

However, having all the students on the same page, working with the same basic drawing methods, helped improve the heredity exercise because it reduced a lot of the variability in the pictures that resulted from different drawing styles and skill levels.

I also think that taking these interludes for art lessons are quite useful in a science class, since it emphasizes the importance of accurate observation, shapes student’s abilities to represent what they see in diagrams, and demonstrates that they can — and should — be applying the skills they learn in other classes to their sciences.

Instruction on how to draw a face.

Natural Selection by Alfred Russel Wallace

Everyone knows about Charles Darwin, but hardly anyone remembers Alfred Russel Wallace, who came up with the idea of natural selection at the same time as Darwin. Darwin’s publication of the On the Origin of Species was spurred on by Wallace. Flora Lichtman and Sharon Shattuck shed a little light on Wallace with this video:

Indeed, from the introduction of On the Origin of Species:

I have more especially been induced to [publish], as Mr. Wallace, who is now studying the natural history of the Malay archipelago, has arrived at almost exactly the same general conclusions that I have on the origin of species. Last year he sent to me a memoir on this subject, with a request that I would forward it to Sir Charles Lyell, who sent it to the Linnean Society, and it is published in the third volume of the Journal of that Society. Sir C. Lyell and Dr. Hooker, who both knew of my work—the latter having read my sketch of 1844—honoured me by thinking it advisable to publish, with Mr. Wallace’s excellent memoir, some brief extracts from my manuscripts.

— Darwin, 1859. On the Origin of Species.

The Dish

The Economic Benefits of Messing with Nature

“… we argue that destroying and replacing the free gifts of nature can be an economic benefit.”
— Gowdy et al. (2012): The Parable of the Bees: Beyond Proximate Causes in Ecosystem Service Valuation via Krulwich Wonders.

Robert Krulwich has a fascinating article that summarizes a research paper that looked into what happened when people had to replace the honeybees to pollinate fruit crops in China. Apparently, from a purely economic standpoint, humans did a better job — they pollinated more flowers — and because people had to be hired to do this, it helped the economy as well.

Despite the economic benefit, summarized by the alarmist quote above, the authors of the article actually use this example to argue that it is foolhardy to use this type of economic analysis for deciding what to conserve.

We do not argue that the positive economic benefits justifies eliminating natural processes. On the contrary, the Maoxian [, China] case illustrates the danger of allowing the logic of the market to drive conservation policy.
— Gowdy et al. (2012): The Parable of the Bees: Beyond Proximate Causes in Ecosystem Service Valuation.

Dr. Sansone

Dendrochronology with Bradford Pears

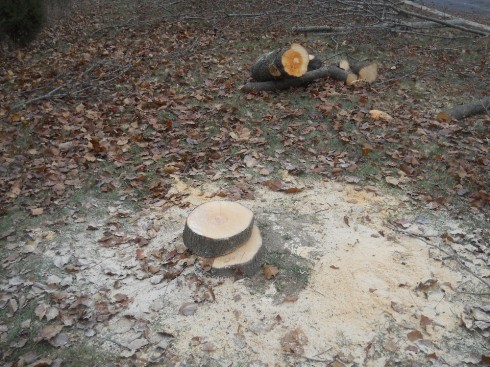
A slice out of the trunk of a Bradford Pear tree.

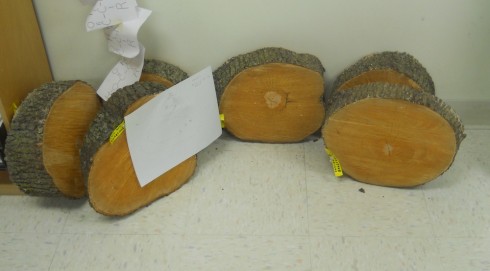
With the help of Scott Woodbury from the Shaw Nature Reserve, Dr. Sansone lead the effort to remove the six mature Bradford Pear trees from the front of the school over the last interim. We collected slices of each of the trees so students could do a little dendrological work with the tree rings.

The trees were planted as part of the original landscaping of the school campus. They’re pretty in the spring and fall, but are an aggressive invasive species.

The fast growth, however, make for wide growth rings. In fact, in addition to the annual rings, there are several millimeter wide sub rings that are probably related to specific weather events within the year. I’d like to see if we can co-relate some of the sub-ring data to the longer term instrumental record of the area.

The tree cutting was quite fun as well, despite being done on a cold day near the end of November. Students helped stack logs and organize branches along the road for the woodchipper. I learned how to use a chainsaw.

Six Bradford Pear tree slices, cut on  November 25th, 2013.
Six Bradford Pear tree slices, cut on November 25th, 2013.

The Science of Cookies

We’ve looked at the simple acid/base reactions that produce the carbon dioxide bubbles in chocolate-chip cookies, but this video goes over a number of other relevant chemical concepts and the temperatures at which changes occur, including:

  • Emulsions: butter is an emulsion that separates into its constituent fats and water at 92ºF,
  • Denaturing proteins: at 144ºF proteins denature and then coagulate,
  • Evaporation: at 212ºF
  • Carbon dioxide production: from the reaction of baking soda and acid in the dough
  • Maillard reactions: at 310ºF amino acids and denatured proteins react with sugars to brown the cookies and create lots of excellent flavors
  • Caramelization: at 356ºF sugars break down and reform into interesting, tasty compounds