Lego Mindstorms

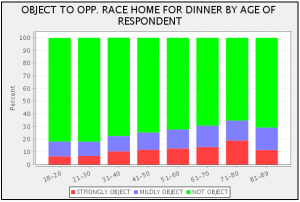
I’ve been curious about the Lego Mindstorms robotic systems for a while now, and I had my first chance to try them at the St. Louis Science Center.

The kits come with a micro-controller, a few motors and some sensors. While there are quite a number of ways of assembling these to make robots, the ones at the science center were pre-built except that you could just plug in a bulldozer or sweeper attachment (and a head which was purely decorative). This limited the degrees of freedom to three, which made it easier to program something useful in the hour we had with the robots.
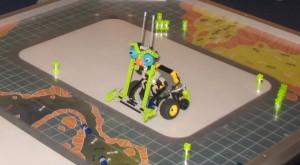
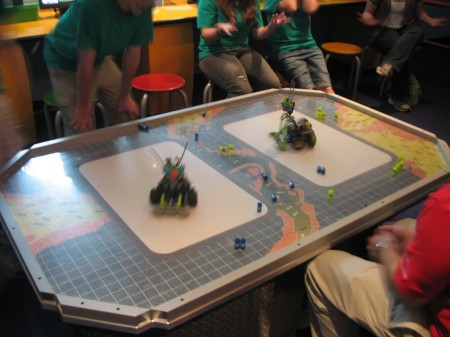
The programming is very basic. There are two sets of instructions, one to control the movement of the robot in general, and one to control its response when the sensor detected a change in the environment. The objective of the science center’s game was to clear off a set of objects from a white rectangle within five minutes.

You could tell the robot to move forward, back or rotate while it’s on the board and to activate its sweeper or shovel. So a full program could have just five elements; general: lower shovel –> move forward –> rotate; sensor: move backward –> rotate. With these strict limitations, the programming interface is also very simple; you plug in blocks with each instruction in the series for either the general movement or the sensor reaction. With all this simplification, I’m not sure just how much the students learned about programming from our short session.

The full kit from Lego offers more freedom to design robots and thus more flexibility with the programming interface so with a little thought it could be easily integrated into the curriculum. At about $300 each the system is a bit pricy, we’d probably need to get one kit for each small group of 3-4 kids. They would probably be worth it however if we used them more than just once.

I’ve been playing with the Basic Stamp micro-controller for a while, and while it offers almost infinite flexibility, making it more useful for practical applications, it does not provide the immediate gratification of the robots, and the ease of assembly to make it the better tool for introducing robotics to middle schoolers. I still, however, tend to favor practical applications, so perhaps I can persuade a student to do an advanced project to build an automatic window for the greenhouse.

The session at the Science Center was worthwhile. All of the students seemed to enjoy it. It provided a nice integration of the mechanics and electronics we’ve been learning about all year, and a glimpse of where technology is taking us in the future.
Captured by PowerPoint

“PowerPoint makes us stupid” – Gen. James N. Mattis

When we create presentations we combine multiple sources of information and reinterpret them in new ways. Presenting demonstrates more sophisticated learning. Yet as we we organize and categorize we fit the reinterpreted information into models and these models themselves impose their own logic. Models are defined by their own rigidity of organization and thinking that can straightjacket both the viewer and the creator of the presentation.

PowerPoint is a ubiquitous and powerful tool. Most of students favor it for their presentations. However, PowerPoint’s model requires breaking things down into bulleted lists, a hierarchical array of topics and subtopics. It makes it harder to show interconnections.

The U.S. military is becoming worried that their extensive use of PowerPoint is making their job harder.

“It’s dangerous because it can create the illusion of understanding and the illusion of control,” General McMaster said in a telephone interview afterward. “Some problems in the world are not bullet-izable.” – Bumiller (2010)

Elizabeth Bumiller has an excellent article in the New York Times about the effect of PowerPoint on the military titled, “We Have Met the Enemy and He Is PowerPoint“. It’s a great reminder of why students need to practice a variety of different presentation techniques.

slides impart less information than a five-page paper can hold, and that they relieve the briefer of the need to polish writing to convey an analytic, persuasive point. – Bumiller (2010)

Sharing and privacy online

How your personal information, provided to Facebook, has become accessible to the rest of the web.

People, kids and adults, are still adjusting to the privacy implications of sharing information online. Not only are we figuring out what to post for the public on social networking websites like Facebook or our blogs, but we’re also deciding what information we want to give to the websites themselves as companies try to tailor a unique online experience for each of us (as with targeted advertising). Laura Holson has an interesting article under the headline, “Tell-All Generation Learns to Keep Things Offline” about how some young adults are scaling back their online sharing as they realize how potential colleges and employers can use that information, especially negative information.

… people ages 18 to 29 were more apt to monitor privacy settings than older adults are, and they more often delete comments or remove their names from photos so they cannot be identified. Younger teenagers were not included in these studies, and they may not have the same privacy concerns. But anecdotal evidence suggests that many of them have not had enough experience to understand the downside to oversharing. – Holson, 2010.

Sharing is a way to increase transparency, which is often a good thing. Learning more about each other may help create a more peaceful world. But privacy can be equally important. We all make mistakes, say things we should not, do things we shouldn’t, especially when we’re young. When we recognize those mistakes and learn from them, there should come a time when they are not held against us.

The web needs a statue of limitations, say five years, so anything about us on the web that’s older than five years should not count. Or perhaps, just as minors can’t be held fully responsible for their actions under the law, non-adults should be held to a different standard on the web.

It is, however, notoriously difficult to erase anything from the web, and I tend to be quite conservative when it comes to sharing things online. Yet the greatest power of the internet, I believe, is that it is based a philosophy similar to the constructivist approach to education. In education the student is constructing their own learning, whereas on the internet, society is constructing and organizing information in ways that look a lot like learning.

So our class Wiki is private, as are our students’ blogs. They provide safer spaces for students to make mistakes, but gives them that essential experience of constructing the internet, not just taking away.

Co-opting the iPod: Flashcards

Flashcard Touch for the iPod Touch

iPod Touches are quite convenient little PDA’s. Beautifully tactile, they are a pleasure to use. A few of my students have them and I’ve had to think long and hard about allowing iPods in the classroom because, for a little while there, students were using them under the table for all sorts of illicit applications (games). I was tempted to ban them outright, and I have not yet made a final decision but I thought I’d try co-opting the devices first.

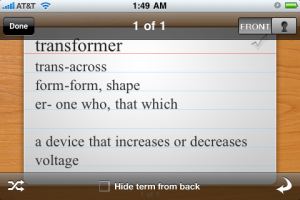
So I now have a few students using the iPod Calendar, taking notes, and now one has found a nice little flashcard app called Cramberry. Apparently, the major selling point was its catch-phrase, “Studying doesn’t have to be painful.” The app costs $4.99 for the full version (the Lite version is useless). I’ve also tested Flashcard Touch myself, which is free this month (March), and it seems to work well (see the screen capture).

PDA’s are still on probation; they can be very useful. The outstanding question is one of trust. Will students use them appropriately, or are they too much of a temptation. A key Montessori principle is that students should take responsibility for their learning and trust is an essential component. I am cautiously optimistic.

Federal Reserve’s economic data

The St. Louis Federal Reserve has a Summer School program for teachers. Two of the sessions deal with current events (banking crisis and jobs) but the third covers the data and primary source documents that bank makes available online (for free). These include the FRED and GeoFred websites.

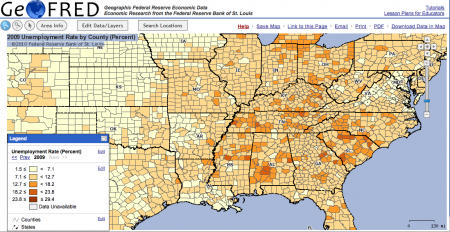
Unemployment data for the Eastern US from GeoFRED.

GeoFred produces graphs like the one above showing economic statistics across the country. It can do it on a state by state basis, by county (as above), or by even more refined areas.

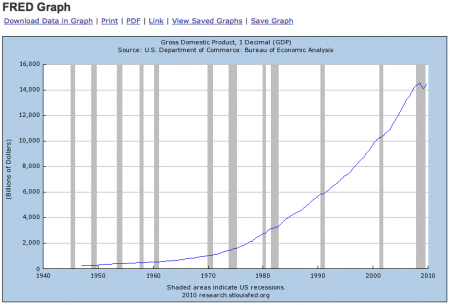
US GDP from FRED.

FRED plots graphs and even provides the data for economic statistics over time. The graph above shows GDP since they started collecting data in the 1940’s. It also has the times of recessions shaded in. The data in the graph can also be downloaded if you want to do your own analysis.

These seem to be handy little tools for teaching and for research projects, and are pretty easy to use.

The teachers’ training sessions are free though you have to get your own housing. They do provide breakfast and lunch. If you want graduate credit for them however, each three day session will cost around $306 and garner one credit.

The SDA

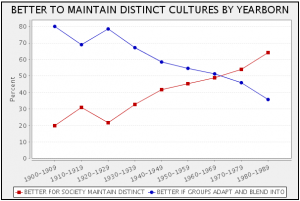
Answers to the question 'Some people say that it is better for a country if different racial and ethnic groups maintain their distinct customs and traditions. Others say that it is better if these groups adapt and blend into the larger society. Which of these views comes closer to your own?' sorted by year in which the respondent was born.

UC Berkley’s Survey Documentation and Analysis (SDA) website has a lot of potential as a research tool for the more advanced middle-schooler. I greatly encourage students to do original research in their semester-long Independent Research Projects. They pose questions, collect and/or analyze data and slog through the challenges of dealing with open ended questions. Middle school is the appropriate time for this as they are working on their formal thinking skills. With the increasing availability of websites like the SDA, everyone can gain access to research grade datasets.

The SDA is powerful because it has a lot of data from survey questions dealing with a large number of survey issues, from race relations, to perceptions of the economy, to use of the web. But with that power is a certain degree of complexity. It took me a while this morning to decipher the web interface and I’m no where near plumbing all the nuances of the statistical analysis, but it’s not too hard to do some basic plots.

Right side of the SDA webpage.

On the left side of the window is a list of all the survey questions available. There are a lot but they each have the full question so it’s pretty easy to figure out what they mean. When you select one, such as the opposition to a family member bringing home a black/negro friend for dinner, it gives you the little code, “RACDIN” in this case that you enter as the Row on the right side of the window (see the above figure). Now I want to know how people’s answers to that question changed based on how old they are, so for the Column option I put in “AGE”. Of course what I actually put in is “AGE(c:10,1)” which tells the program to lump all the age data into 10 year sets, starting at age 1.

Answer to the question, 'How strongly would you object if a member of your family wanted to bring a (negro/black) friend home to dinner?' sorted by age of the respondent.

Students will certainly need help getting started, and I could add video instructions if anyone wants it.

Now comes the most interesting part, interpreting the graphs. I like the plot at the top of this post for this reason. It shows that the younger people are the more likely they are to think it’s better if racial and ethnic groups maintain their customs and traditions. Does this mean that younger people have more racist attitudes, trying to maintain separation, or does it mean that they are more accepting of different cultures?

Blocking Wikipedia

From Wikimedia Commons

It’s not as much of an issue in science (Natural World) but because it tends to pop up to the top of the search engines, my students tend to overuse Wikipedia, so I’m considering, at least as an experiment, blocking it. Wikipedia tends to be reliable in general, but its open nature, where anyone can edit also means that it can also be spectacularly wrong.

I use, and I encourage my students to use Wikipedia for two things, finding images that are not restrictively copyrighted (almost all images on Wikipedia are free for anyone to use since that is a specific part of their policy), and finding, at the bottom of the articles, the list of references to what are usually credible sources for the topic they are researching. While this seems to work well for science research, because Wikipedia’s articles tend to be too technical for middle schoolers, some of my students have been burned when using Wikipedia articles as a reference for their social world projects.

So I’m going to try blocking Wikipedia for a week and see what happens. Students can still use Wikimedia Commons for images, but they’ll have to find sources in other ways.