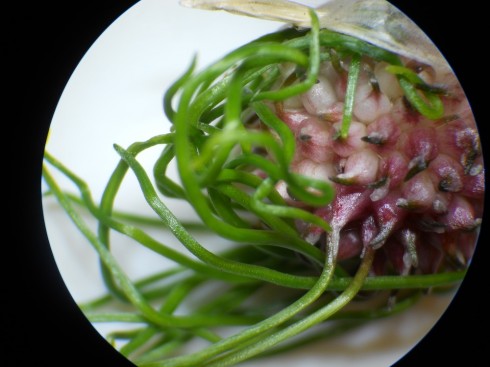
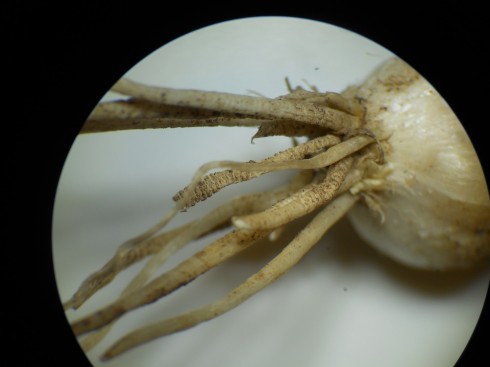
I just like this picture.
Pictures of Hydrogen Atoms
Return to 3rd Degree
Last weekend, I took the Glass Art Sampler class at the Third Degree Glass Factory, and got to try my hand at making a paperweight, a glass tile, and a few beads. It was awesome.
I’d had the chance to make a paperweight when my Lamplighter class had visited St. Louis a couple years ago, so I had a general idea of some of the possibilities. This time, however, I had DNA sequences on the brain, and went in with a bit of a theme in mind.
The tiles were the easiest because all you need to learn how to do was cut glass — by scoring it and using a little pliers like device to break it along the score — and then arrange the tiles of colored and clear glass on a tile. The arrangement was placed in a flat kiln, and then a day or so later, you tile would be all melted together. Pretty simple for a beginner.
There is, of course, a bit more to it than that. The way the glass is stacked can be used to create floating effects; some colors will react when melted in the kiln to give different colors; care needs to be taken to manage where bubbles show up in the cooled glass; among other things.
Since it’s easiest to make straight edged cuts in glass, I made four sets of square colored tiles — yellow, red, blue, and green — to make a nucleotide sequence based off the DNA Writer translation table (with the start and stop codons added in).
Paperweight
I tried something similar when making the paperweight.
Usually, you start with a blob of molten, clear glass on the end of a metal rod, and dip it into trays of colored glass shards that stick to the molten glass. You can then pull and twist the viscous glass with a large pair of tweezers to blend the colors and make pretty patterns. The twisted glass is then pushed into a blob at the end of the rod, and the whole thing encased in more clear glass.
Instead, I wanted to create a discernible pattern of colors to create a multi-colored helix of molten phenocryst-like blobs in the clear glass. I really wasn’t sure how to make it work. I though perhaps I could dip the initial glass blob into a pattern of shards and then pull it out once while twisting to get the spiral pattern. Our instructor was patient as I tried to explain my ultimate goal, and he came up with a more subtle method for making the spiral.
I laid out the short pattern of colored glass shards and carefully dipped the initial blob of clear glass into it. All the shards stuck, which was good. Then instead of pulling with tweezers, the instructor helped my gently roll the blob of glass along a metal surface at a slight downward angle. Contact with the metal cooled the tip of the glass faster than rest of the blob causing the whole thing to twist just nicely. After smoothing things with a block we covered it with more clear glass (and smoothed again), and were done.
One week later:
Working with big blobs of extremely hot glass is quite challenging, so I couldn’t replicate this on my own at the moment. I may have to take another class.
Glass Beads
I would feel comfortable making glass beads after the one class, but mastering the art is going to take a lot of practice. The flame — created from a mix of fuel gas (propane I think) and oxygen — is quite hot, and it takes some expertise to be able to melt the glass and twirl it onto the rods to make a nice round bead. The trickiest part, however, is making little colored dots to decorate the bead. You need to melt small bits of glass for the dots, then move the bead through the flame to warm it up enough so the dot will stick to the bead while not melting the bead too much. Then you pass the bead through the flame again to set the dot. If the bead or the dot is too cool when they’re put together the dots will pop off. I had a lot of popping dots.
I was not able to get my nucleotide sequence onto a bead in the time I had, but I did at least get to make a couple beads.
Imagining Geography
One of the games Dr. A. plays with the middle school geography class is to have them use the soccer field as a large map. They chose a place and someone runs to its location on the field. What I like is that he insists that the map be all in their heads. They might have one or two control points, but they have to visualize the map mentally.
I saw them out on the soccer field today, and I thought I’d make their imaginary map a little more literal in Gimp.
UPDATE: Dr. A[ustin] clarifies the rules of the competitive game they were playing in the comments below, in case anyone wants to try it.
Update 2: Move your mouse over the image below to see the picture with or without the map (larger version here).
Windows and Warblers
Unfortunately, the method of the demise of the worm-eating warbler that flew into our window appears to be more the rule than the exception. David Sibley (2010) calculates that windows are the number one, people-influenced, cause of death for birds.
Notice that cats are number two on the list.
What are the odds?
My middle school class stumbled upon a nice probability problem that I might just use in my pre-calculus exam.
Oregano
You see, four of my students took cuttings of oregano plants from the pre-school herb gardens when we were studying asexual reproduction, but only three of them grew roots.
That gives a 75% success rate.
The next time I do it, however, I want each student to have some success. If I have them take two cuttings that should increase the chances that at least plant will grow. And we can quantify this.
If the probability of success for each cutting is 75% then the probability of failure is 25%.
P[failure] = 0.25
Given a probability of one plant failing of 25%, the probability of both plants failing is the probability of one plant failing and the other plant failing, which, mathematically, is:
P[2 failures] = P[failure] x P[failure]
P[2 failures] = 0.25 x 0.25
P[2 failures] = 0.252
P[2 failures] = 0.0625
So the probability of at least one plant growing is the opposite of the probability of two failures:
P[at least 1 success of two plants] = 1 – P[2 failures]
P[at least 1 success of two plants] = 1 – 0.0625
P[at least 1 success of two plants] = 0.9375
which is about 94%.
If I had the students plant three cuttings instead, then the probability of at least one success would be:
P[at least 1 success of 3 plants] = 1 – P[3 failures]
P[at least 1 success of 3 plants] = 1 – 0.253
P[at least 1 success of 3 plants] = 1 – 0.02
P[at least 1 success of 3 plants] = 0.98
So 98%.
This means that if I had a class of 100 students then I would expect only two students to not have any cuttings grow roots.
An Equation
In fact, from the work I’ve done here, I can write an equation linking the number of cuttings (let’s call this n) and the probability of success (P). I did this with my pre-calculus class today:
so if each student tries 4 cuttings, the probability of success is:
P = 1 – 0.254
P = 1 – 0.004
P = 0.996
Which is 96.6%, which would make me pretty confident that at least one will grow roots.
However, what if I knew the probability of success I needed and then wanted to back calculate the number of plants I’d need to achieve that probability, I could rewrite the equation solving for n:
Start with:
isolate the term with n by moving it to the other side of the equation, and switching P as well:
take the natural log of both sides (we could take the log to the base 10 if we wanted, or any other base log, but ln should work just as well).
now use the rules of logarithms to bring the exponent down into a multiplication:
solving for n gives:
Note that the probability has to be given as a fraction (between 0 and 1), so 90% is P = 0.9. A few of my students made that mistake.
Lavender
At the same time my students were making oregano cuttings, six of them were making cuttings of lavender. Only one of the cuttings grew.
So now I need to find out how many lavender cuttings each student will have to make for me to be 90% sure that at least one of their cuttings will grow roots.
Students can do the math (either by doing the calculations for each step, or by writing and solving the exponential equation you can deduce from the description above), but the graph below shows the results:
Here is Today: Our Place in Geologic Time
Here is Today is a neat little interactive website that helps put the geologic timescale, and homo sapiens’ place in it, into perspective.
One Spring’s Month
A month in the spring can make a huge difference. Move your mouse over the image (or click the image) to see the difference between April and May on the Fulton School campus.
The full sized images can be seen here.
Note: To embed the image above use:
<iframe style=”overflow:hidden;” src=”http://earthsciweb.org/js/images/spring/spring.html” width=490 height=326 seamless />