Graphing Polynomials

Try it. You can change the order and coefficients of the polynomial. The default is the second order polynomial: y = x2.

I originally started putting together this interactive polynomial app to use in demonstrating numerical integration, however it’s a quite useful thing on its own. In fact, I’ve finally figured out how to do iframes, which means that the app is embeddable, so you can use it directly off the Muddle (if you want to put it on your own website you can get the embed code).

This app is a rewritten version of the parabola code, but it uses kineticjs instead of just HTML5 canvases. As a result, it should be much easier to adapt to make it touch/mouse interactive.

Analyzing the Motion of Soccer Ball using a Camera and Calculus

Animation showing the motion of the ballistic motion of a soccer ball.

If you throw a soccer ball up into the air and take a quick series of photographs you can capture the motion of the ball over time. The height of the ball can be measured off the photographs, which can then be used for some interesting physics and mathematics analysis. This assignment focuses on the analysis. It starts with the height of the ball and the time between each photograph already measured (Figure 1 and Table 1).

Figure 1. Height of a thrown ball, measured off a series of photographs. The photographs have been overlaid to create this image of multiple balls.

Table 1: Height of a thrown soccer ball over a period of approximately 2.5 seconds. This data were taken from a previous experiment on projectile motion.

Photo Time (s) Measured Height (m)
P0 0 1.25
P1 0.436396062 6.526305882
P2 0.849230104 9.825317647
P3 1.262064145 11.40310588
P4 1.674898187 11.30748235
P5 2.087732229 9.657976471
P6 2.50056627 6.191623529

Assignment

  1. Pre-Algebra: Draw a graph showing the height of the ball (y-axis) versus time (x-axis).
  2. Algebra/Pre-calculus: Determine the equation that describes the height of the ball over time: h(t). Plot it on a graph.
  3. Calculus: Determine the equation that shows how the velocity of the ball changes over time: v(t).
  4. Calculus: Determine the equation that shows how the acceleration of the ball changes with time: a(t)
  5. Physics: What does this all mean?

Rates of change: 4 cm/liter

The first stage rocket booster separates. Image from NASA via Wikipedia.

Fully loaded, the first stage of the Saturn V rockets that launched the Apollo missions would burn through a liter of fuel for every four centimeters it moved. That’s 5 inches/gallon, which, for comparison, is a lot less than your modern automobile that typically gets over 20 miles/gallon.

Ski Trip (to Hidden Valley)

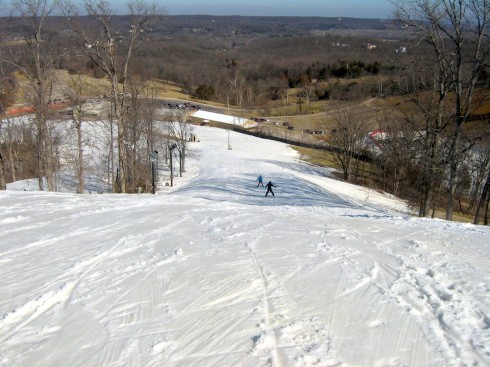
Approaching a change in slope.

We took a school trip to the ski slopes in Hidden Valley. It was the interim, and it was a day dedicated to taking a break. However, it would have been a great place to talk about gradients, changes in slopes, and first and second differentials. The physics of mass, acceleration, and friction would have been interesting topics as well.

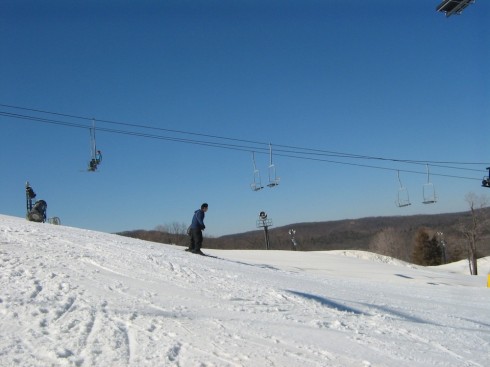
Calculus student about to take the second differential.

This year has been cooler than last year, but they’ve still struggled a bit to keep snow on the slopes. They make the snow on colder nights, and hope it lasts during the warmer spells. The thermodynamics of ice formation would fit in nicely into physics and discussion of weather, while the impact of a warming climate on the economy is a topic we’ve broached in environmental science already.

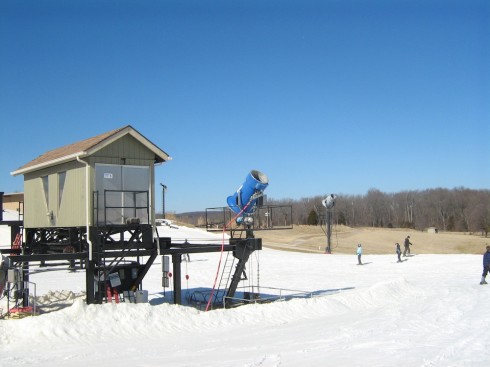
The blue cannon launches water into the air, where, if it’s cold enough, it crystallizes into artificial snow. The water is pumped up from a lake at the bottom of the ski slopes.

Influence Explorer: Data on Campaign Contributions by Politician and by Major Contributors

Influence Explorer is an excellent resource for assessing data about money in politics.

The website Influence Explorer has a lot of easily accessible data about the contributions of companies and prominent people to lawmakers. As a resource for civics research it’s really nice, but the time series data also makes it a useful resource for math; algebra and pre-calculus, in particular.

Seeing Functions at the City Museum

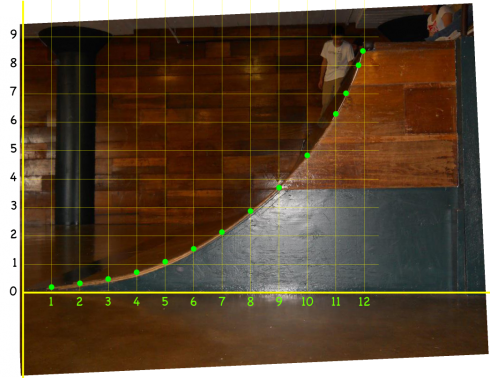
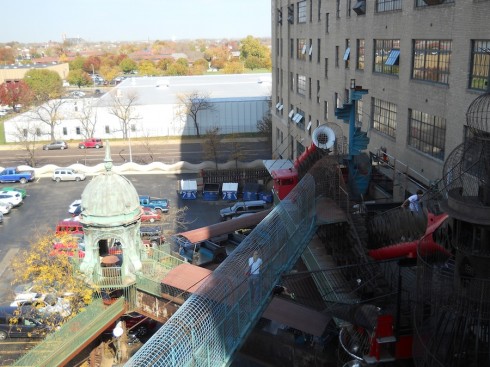
The slide on the third floor of the City Museum. A co-ordinate system is overlayed, and points showing the curve of the slide are selected.
Elegant curves.

I asked my students to take pictures of the curves they found while on our field trip to the scrap metal playground that is the City Museum. The plan is to see if we can determine what functions best fit the curves. To do so, we need to transfer the curves from the images to a co-ordinate system. Since I’m primarily interested in what type of functions might best fit the data, the scale of the co-ordinates does not matter that much.

Feet, inches, meters, centimeters, pixels, or any other units can be used. In fact, I use a purely arbitrary set of coordinates in the image above. All I require is that the grid be evenly spaced (although the vertical and horizontal spacing don’t have to be the same, it’s more straightforward if they are).

Now we take a set of points that lie on our shape and try to match them to some sort of curve using a spreadsheet, and, if we’re able, least squares regression.

There were lots of shapes to choose from.

There were lots of shapes to choose from, including the nice sinusoid in the background.

And the Snakes Ate the Birds who Ate the Spiders

The introduction of snakes to Guam has reverberated through the ecosystem.

Accidentally introduced to the island in the 1940s, the snake decimated the island’s native bird species in one of the most infamous ecological disasters from an invasive species.

By the 1980s, 10 of 12 native bird species had been wiped out.

Since many birds consume spiders, compete with spiders for insect prey and utilize spider webs in their nests, their loss has led to a spider explosion on the island, researchers said.

UPI (2012): Bird loss has island overrun with spiders

Note (for the Algebra students): The scientific article includes a nice box and whisker plot showing how many more spiderwebs there are on Guam compared to other islands.

Number of spider webs on different islands. Guam is the only island shown that has had a severe reduction in birds. Image from Rogers et al., 2012.