The (almost) Perfect Teacup

It’s a glass really. Double walled, liquid suspended in air, beautiful to look at. But it really becomes a wondrous artifact of engineering when its combined with the heavy, rubber and stainless steel lid. The beauty and thermal efficacy of this tea-making system is … elegant. It’s certainly a worthy starting point for our discussion of heat, temperature and thermodynamics in general, and generates interesting questions about heat transport (convective, evaporative, conductive and radiative) and the greenhouse effect, that can be tested with relatively simple experiments.

The first, and most obvious thing my students observed was the fact that the lid prevented heat escaping. The weight of the lid confines the head space, which reduces convective heat loss above the cup and increases the vapor pressure, which reduces the amount of tea that evaporates. Evaporation is the primary way heat is lost from hot liquids, since each gram that evaporates takes 540 calories of heat with it. A simple evaporative heat loss experiment showed that about 70% of the cooling of a cup of water came from evaporation.

The second thing the students pointed out is that the double walled glass insulates, because it reduces conductive heat loss. Solid glass has a thermal conductivity of about 0.24 cal/(s.m.K) (Engineering Toolbox.com; 1 J = 0.24 calories). The conductivity of the air in the space between the walls is two orders of magnitude less at 0.0057 cal/(s.m.K). Of course, having a vacuum in the space would be even better, but it would test the strength of the glass.

Thermally, the glass falls short when it comes to radiative heat loss. A silvery coating would reflect radiated heat back into the cup much better than transparent glass. However, silica glass is relatively opaque to infra-red, which should reduce radiated heat emission. A simple experiment, comparing the cooling rates of water a glass flask wrapped in aluminum foil to one without the foil should give some indication if radiative heat loss is significant.

Finally, the glass does have a thermal advantage though, via the greenhouse effect. Because it is transparent to short, high-energy wavelengths of light, like that of sunlight, but blocks the longer wavelengths of heat energy, the glass should be able to capture some heat from sunlight. This can also be experimentally tested with a couple flasks in the sun. It would be interesting to find out how any greenhouse warming compares to the radiative heat loss through the glass walls.

Last week my students did some basic observations and came up with their own experiments. Then they learned a little about thermodyamics from reading the textbook. This week, we’ll try to get a little more quantitative with the experiments and applications of what they know, and it should be interesting to see if what they’ve learned has changed the way they observe the common objects around them.

Evaporative Heat Loss from a Cup Experiment

This simple experiment was devised to estimate just how much heat is lost from a teacup due to evaporation as compared to the other types of heat loss (conduction and convection).

Experimental setup for measuring evaporative heat loss.

The idea is that if we can measure the mass of water that evaporates over a short period of time, we can calculate the evaporative heat loss because we know that the amount of heat it takes to evaporate one gram of water (its latent heat of evaporation) is 540 cal/g. So we’ll take some hot, almost boiling, water and weigh and take its temperature as it cools down.

Materials

Apparatus.

It requires:

  • A thermometer (Celcius up to 100 degrees)
  • A styrofoam cup (because it’s light)
  • A digital scale (to take quick measurements to tenths of a gram)
  • A 100 ml graduated cylinder (optional)
  • A beaker (100 ml) or cup that can go in the microwave
  • water

Procedure

Our scale has a capacity of about 120 g so we need to make sure that the combined weight of our apparatus that will go on the scale is less. The plan is to have the styrofoam cup, with a thermometer and some water on the scale. Since we can be somewhat flexible with how much water is in the cup we’ll first weigh the cup and thermometer.

(my measurement, not necessarily yours)
Mass of styrofoam cup and thermometer = 29.6 g

So it should be safe to use 70 g of water, which is approximately equal to 70 ml since the density of water is 1 g/ml.

1. Measure the 70 ml of water in the graduated cylinder and put it into the beaker (or microwavable cup). The exact volume is not crucial here since we’ll be using the scale to measure the mass of water more precisely.

2. Microwave the water for about 40 seconds. Again you do not have to be too precise here, you just want the water to be close to boiling. The length of time you need to microwave the water will depend on the strength of your microwave. 40 seconds raised the temperature of my 70 ml of water from 22˚C to 82˚C. If you like you can calculate the heat absorbed by the water, and the effective power of the microwave from these numbers, but it is not necessary for this experiment.

3. Quickly place the hot water into the styrofoam cup with the thermometer on the scale and measure the mass and the temperature of the water.

4. Measure the mass and temperature of the water every 2 minutes for the next 10 minutes.

Calculations

1. Every time you took a measurement, the temperature and the mass should have dropped. The change in mass is due to evaporation. Every time one gram evaporated, 540 calories are lost. Calculate the amount of heat lost due to evaporation at every time measurement.

Hint: Evaporative Heat Loss = mass evaporated × latent heat of evaporation
QE = mE LE

2. Now that you know how much heat was lost, you can figure out how much of the temperature drop was caused by evaporation. Since the specific heat capacity of water is 1 cal/g/˚C, each calorie lost due to evaporation should have reduced the temperature of one gram of the water by one degree Celsius.

Hint: Evaporative Temperature Change = Evaporative Heat Loss × mass of water in container × specific heat capacity of water
∆TE = QE / (m Cw)

You should also the temperature drop caused by evaporation as a percentage of the total temperature drop. Hopefully, your result is less than 100%.

For comparison, here is my data: Evaporative Heat Loss Results and Calcualtions

Discussion and Conclusion

There are quite a number of things that might come up in discussion here, for example: just how large are the potential for measurement errors; and are the results comparable to an actual teacup.

My trial of this experiment indicated that about 69% of the heat loss was due to evaporation. It should be possible to also calculate the amount of heat loss from conduction through the walls of the cup; the thermal conductivity of styrofoam is 0.033 W/mK (via the Engineering Toolbox). The radiative heat loss can be estimated using Stefan’s Law, which can be used to account for all the different methods of heat loss.

Finally, there is no control described in this experiment. A useful thing to try would be to use a styrofoam cup with a lid.

Additional Notes

When my students tried this experiment they use a small (50ml) beaker and 25g of water. Their evaporative heat loss was only 44% of the total, probably due to the smaller volume of water, which as a larger surface-area to volume ratio, and the thinner, more conductive glass walls of the beaker.

Match Stick Rockets

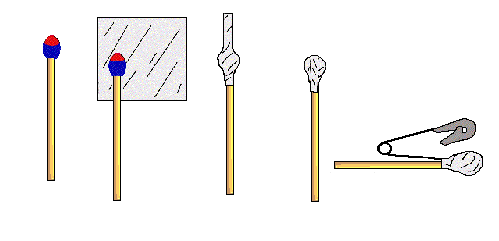
A great, simple, and slightly dangerous way of making rockets. There are a number of variations. I like NASA’s because they have a very nice set of instructions.

How to make a match stick rocket. By Steve Cullivan via NASA.

With a stable launch platform that maintains consistent but changeable launch angles, these could be a great source of simple science experiments that look at the physics of ballistics and the math of parabolas (a nice video camera would be a great help here too) and statistics (matchsticks aren’t exactly precision instruments).

Using Chromatography as an Analogue for DNA Fingerprinting

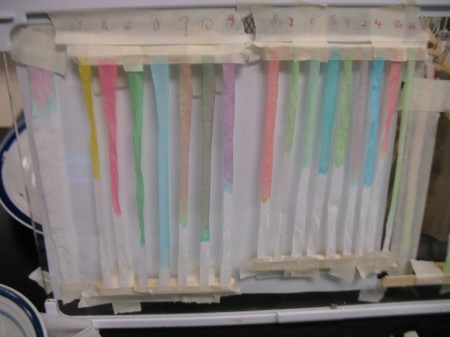
Color 'fingerprints', with four color standards labeled Y (yellow), R (red), G (green), and B (blue).
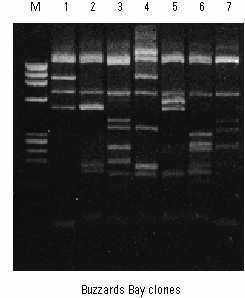
Gene sequences extracted from sediment in Buzzards Bay, MA, and separated using gel electrophoresis (Image from Ford et al., 1998)

One of the more basic techniques in the microbiologist’s toolkit is gel electrophoresis. It’s used to separate long molecules, like proteins, RNA and DNA from one another. Different organisms have different DNA sequences, so electrophoresis can be used to identify organisms and for DNA fingerprinting. Chromatography is also used to separate different molecules, usually pigments. Therefore, using some filter paper, food coloring, and popsicle sticks I created a nice little chromatographic fingerprinting lab exercise using chromatography as an analogue for electrophoresis.

Food colors and test tubes.

Using a standard set of four food colors (red, blue, green and yellow), I grabbed each students individually and had them add three drops of the colors of their choice to a test tube with 1 ml of water in it. One students went with three straight blue drops, but most picked some mixture of colors. I kept track of the color combinations they used, and labeled their test tube with a unique, random number.

When they’d all created their own “color fingerprint” in the test tubes, I handed them back out randomly, and gave them the key of names and color combinations (but no numbers). They had to find out whose test tube they had.

Diffusion of a drop of dye mixture through filter paper. At least three different colors are visible. The colors at the outer edge are the most difficult to distinguish.

I was kind enough to give them a few little demonstrations of chromatography I’d been experimenting with over the last day or so. The easiest technique is simply to place a couple drops of the sample on a filter paper (we used coffee filters “requisitioned” from the teachers lounge), and chase it with a couple drops of water to help the dye spread out. This method works, but since the sample spreads out in a circle, the inverse square law means that the separation of colors can be hard to see.

While the drop method worked well for most students, one who was a bit more analytically-minded, interested in the project, and had a particularly difficult sample, tried doing it using a filter paper column. Since I wanted to show them the proper way of conducting experiments, particularly about the importance of using standards, and I wanted to check if they were able to interpret their results correctly, I also did the full set of samples myself as columns. The standards are essential, because the green food color is actually a mixture of green and blue dyes.

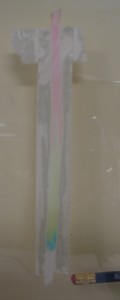
Our color chromatography setup is as you see at the top of this post. We used popsicle sticks to keep the filter paper strips away from the glass surface.

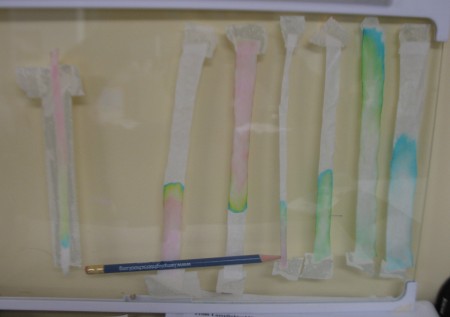
Experiment with filter paper taped to the glass.

The experiments worked well, and for best results, let the it dry because the colors show up better. One focus with my students was on note-taking and recording results; after a few iterations that worked out well too. Another nice aspect of using the series of columns is that it looks a lot like the electrophoresis bands.

I did try some other variants of the chromatography: top down, bottom up and even taped down. The last version, where I taped the filter paper to the glass to create a restricted column, worked very well.

Variants of the experimental setup are shown in the three columns from left: taped down where the filter paper is taped to the glass; bottom up, where movement of the water and die is driven by capillary action; and top down, where the sample droplet is placed at the top of the column.