How to Write Lab Reports

If I have seen further it is only by standing on the shoulders of giants
— Isaac Newton (1676) via Wikiquotes.

Science advances when scientists share their results. If someone tests an hypothesis and finds that it’s wrong, if they share their results, others won’t have to waste time by repeating the same experiments. If someone makes a breakthrough and publishes what they found, then scientists all around the world can use that information to develop new experiments and new applications of that newly discovered principle. Sharing is essential, so it’s important for students to learn how to share well.

Scientists usually communicate their results by giving presentations to other scientists at conferences and publishing articles in scientific journals. Often these presentations are full of the specialized language different types of scientists use with each other, so sometimes science journalists will translate that into regular English news articles that everyone can read and understand. The New York Times and the BBC have good science sections, but what they present comes first from scientists’ formal presentations and articles.

As a result, good presentations and good lab reports are a great way to start learning how to communicate like a scientist.

Lab Reports

A good way to figure out what should go into a lab report is to look at a published article. We have a bunch of copies of Science, which has research articles toward the middle and the back. Articles in Science tend to be brief and fairly dense because it’s one of the premiere journals, so the outlines are not as explicit as you’d find in other places; an Open Access Journal might provide better examples, especially if you’re looking them up online.

Based on our observations, we decided on the following parts for a good lab report:

  • Title: Be short, but unique to give a good idea of what your project is about. Since my classes seldom all do the same experiment, this is very useful. Answer the questions: What did you do? Why did you do it? and What did you find?
  • Authors: Who gets the credit for the work. Usually authors are listed by who did the most work first, but since everyone’s expected to work equally on their group projects you can choose some random or arbitrary order.
  • Abstract: A brief summary of the work, include: what is the problem you’re trying to solve; what you did to solve the problem; and what results you came up with. The abstract should contain all the spoilers.
  • Introduction: Go into some more detail about what the problem is you’re working on, and why it’s important. State your hypothesis and how you’re going to test it. Overview previous work your project is based on.
  • Procedure/Methods: Describe, in detail, what you did, what apparatus you used. Both words and diagrams are useful here.
  • Results: Tell us what you found. Graphs, charts and tables will be very useful here.
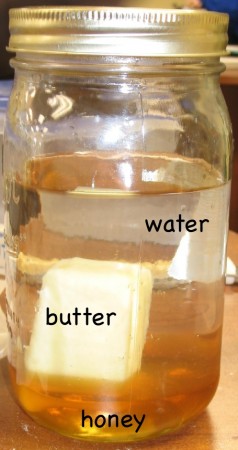
  • Figure 1. An example of a diagram. In this case labels have been placed on a photograph of the apparatus. Notice also the caption, which you are reading at this very moment, that goes with the figure.
  • Note on Figures: You should have figures, charts, diagrams and tables in your Procedure and Results sections, but you can have them anywhere they’re appropriate. Each figure needs to have a caption explaining the figure. A useful approach to figures and captions is to try to write them so that someone could understand the entire article by only looking at the figures and reading their captions. One of my students says that popular magazines, like People, are written that way (or at least that’s how they’re read).
  • Analysis and Discussion: To paraphrase a student, “Explain why you think you got those results.” Even if the results are unexpected, or especially if they’re unexpected, you need to explain them. This is also your chance to explain why all of your critics are wrong and you were right all along. If you do that though, it should be written in scientific, passive-aggressive language.
  • Conclusions: Summarize. In the abstract you’re telling them what you’re going to tell them. In the Introduction, Procedure, Results and Discussion sections you’re telling them. In the Conclusion, you’re telling them what you told them. Hopefully by that time they’ll have had enough chances to figure out what you were trying to tell them.
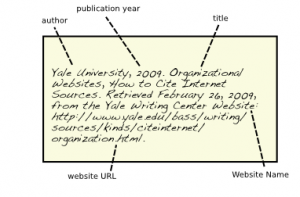
  • Figure 2. An example of a citation for a website.
  • References: Be sure to include a list of the references you used to do your work. This is how you give credit to the people who’s work you are building on. The Yale Library has an excellent page on citing sources. There are a different citation styles you can use but remember the purpose: to give credit where it’s due, and to allow others to be able to find those references easily. All citations should have the author, the date published (or when you accessed it if it is a website), the title, and a way to track down the work.

Note that scientific magazines, like Science and Nature, are very different from a popular magazine like People, for one thing, as was pointed out to me today, the pages don’t smell like perfume (instead they smell like science).

Updates

This paper, on how to bend a soccer ball, is a good example of a student research paper.
The Freezing Core Keeps the Earth Warm

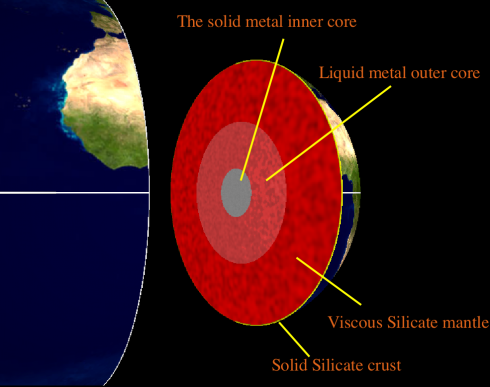
The internal structure of the Earth.

The inner core of the Earth is made of solid metal, mostly iron. The outer core is also made of metal, but it’s liquid. Since it formed from the solar nebula, our planet has been cooling down, and the outer core has been freezing onto the inner core. Somewhat counter-intuitively, the freezing process is a phase change that releases energy – after all, if you think about it, it takes energy to melt ice.

The energy released from the freezing core is transported upward through the Earth’s mantle by convection currents, much like the way water (or jam) circulates in a boiling pot. These circulating currents are powerful enough to move the tectonic plates that make up the crust of the earth, making them responsible for the shape and locations of the mountain ranges and ocean basins on the Earth’s surface, as well as the earthquakes and volcanics that occur at plate boundaries.

Conceptual drawing of assumed convection cells in the mantle. (via The Dynamic Earth from the USGS).

Eventually, the entire inside of the earth will solidify, the latent heat of fusion will stop being released, and tectonics at the surface will slow to a stop.

The topic came up when we were talking about the what heats the Earth. Although most of the energy at the surface comes from solar radiation, students often think first of the heat from volcanoes.

Note: An interesting study recently published showed that although the core outer core is mostly melting, in some places it’s freezing at the same time. Unsurprising given the convective circulation in the mantle.

Model of convection in the Earth's mantle. Notice that some areas on the mantle are hotter, creating hot plumes, and some are cooler (image from Wikipedia).

Note 2: Convection in the liquid outer core is what’s responsible for the Earth’s magnetic field, and explains why the magnetic polarity (north-south) switches occasionally. We’ll revisit this when we talk about electricity and dynamos.

Live from 1500 Meters Deep

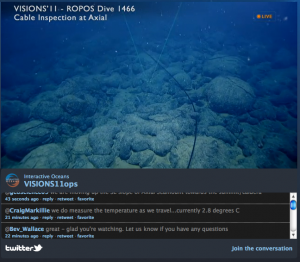
Link to live video feed from the ROV ROPOS surveying a cable on the ocean floor at the Juan de Fuca midocean ridge.

Live science. The remotly operated submersible ROV ROPOS is surveying an undersea cable recently laid across the the Juan de Fuca midocean ridge.

This scientific expedition will be going on until the end of August, and there’ll be live feeds every time the rover is deployed (which depends a bit on the weather at the surface).

If you have questions, they’re also answering your tweets.

Right now, the rover’s heading toward the caldera of the axial seamount volcano. It should get there some time tonight (if they don’t have to stop for anything). So far, we’ve seen dumbo octopuses, crabs, weird fish, brainless worms, sponges, deep sea corals, starfish and lots of pillow basalt. The basalts are unsurprising because these are the rocks produced when volcanos erupt under water.

Dumbo octopus (from the ROV ROPOS seafloor gallery at Interactive Oceans).

Guide to Using a Microscope

Sitting innocuously on the clearance table at a Barnes & Noble (in Cedar Rapid, Iowa actually) was a copy of Georg Stehli’s The Microscope and How to Use It.

At 75% off it was less than $3, which is quite a steal for a guide to what I found to be the most fascinating piece of scientific equipment for my middle schoolers. One of their first natural world lessons was on how to use the microscope. In the classroom there was always one sitting on the shelf, protected by its translucent plastic cover, but easily accessible.

I also took one everywhere, including to the cabins on our immersion trips, which is where they discovered the crystalline structure of salt and sugar grains, and the microfossils at Coon Creek.

And, interestingly enough, my microscopy posts are some of the most popular posts on this blog (the onion cell is regularly in the top ten).

The Microscope and how to use it by Georg Stehli.

Apart from the basics of how to use a microscope, Stehli’s book goes into simple sample preparations and preservation for almost everything you’re likely to encounter in the curriculum, in the classroom, and in the back yard. Though neither crystal structure nor microfossils are covered, the techniques for looking a the hard parts of biological specimens are applicable.

I would have loved to have had a copy of this last year when I was trying to figure out which were the best dyes to use for some of the odder samples my students came up with, and how to make them into permanent slides. It’s not easy to find this kind of broad reference online.

Build Your Own Solar System: An Interactive Model

National Geographic has a cute little game that lets you create a two-dimensional solar system, with a sun and some planets, and then simulates the gravitational forces that make them orbit and collide with each other. The pictures are pretty, but I prefer the VPython model of the solar system forming from the nebula.

The models starts off with a cloud of interstellar bodies which are drawn together by gravitational attraction. Every time they collide they merge creating bigger and bigger bodies: the largest of which becomes the sun near the center of the simulation, while the smaller bodies orbit like the planets.

This model also comes out of Sherwood and Chabay’s Physics text, but I’ve adapted it to make it a little more interactives. You can tag along for a ride with one of the orbiting planets, which, since this is 3d, makes for an excellent perspective (see the video). You can also switch the trails on and off so you can see the paths of the planetary bodies, note their orbits and see the deviations from their ideal ellipses that result from the gravitational pull of the other planets.

I’ve found this model to be a great way to introduce topics like the formation of the solar system, gravity, and even climate history (the ice ages over the last 2 million years were largely impelled by changes in the ellipticity of the Earth’s orbit).

National Geographic’s Solar System Builder is here.

What’s Needed for a Nation’s Peace

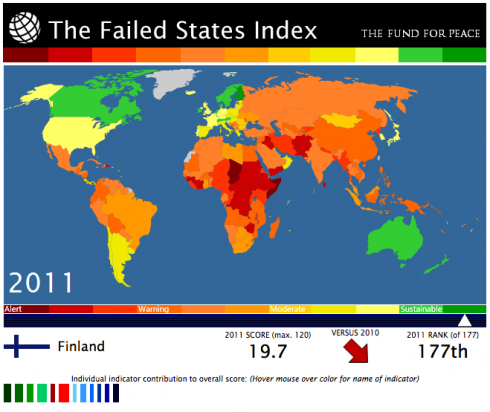
The Fund for Peace has been doing a lot of thinking about what it takes for a country to be considered peaceful, and what it takes for a state to fail. For the last seven years they’ve been putting together maps of the world with an index of how stable different countries are.

Finland - the most sustainable state, at least according to the Failed State Index.

While it’s pretty in-depth and makes for rather sobering reading, it’s worth taking a look at the criteria they’ve come up with to determine a country’s stability. It may be useful to include some of this information in the cycle where we focus on peace.

Their criteria for instability include:

  • Demographic pressure (such as having too many young adults, as we’ve seen in Egypt)
  • Amount of refugees and internally displaced peoples (refugees are people who’ve crossed international borders). Both leaving or entering refugees can undermine stability.
  • Historical Injustice – communities can have an understandably hard time forgetting the past, just look at Isreal/Palestine.
  • Brain Drain – when countries start to fail, the first to leave are the ones who can afford to. Yet these intellectuals and professionals, with their college degree are vital for creating a stable and prosperous country.
  • Inequality – especially when driven by active discrimination (wealth inequality is something to watch out for).
  • Economic decline – pushes trade into the black market and increases criminality and corruption.
  • Illegitimacy of the state – if people don’t believe the people in government have everyone in the country’s best interests at heart, and are only looking out for themselves and their friends, then there’s probably going to be trouble.
  • Public Services go kaput – It’s a really bad sign when the government can meet people’s basic needs – like picking up the garbage.
  • The Rule of Law goes kaput – when you’re ruled by the caprice of men, and your rights under the law are not respected, you may begin to consider and agitate for other options for government.
  • Personal Armies – forces that are tied to individual leaders, like private militias or super-secret police for example, are very damaging to a country’s cohesion.
  • Fighting elites – healthy countries need robust arguments in their political class – think checks and balances – but it can go too far and lead to things like extreme nationalism and ethnic cleansing.
  • Invasion – both overt invasion and covert meddling in the affairs of a country are unhealthy for that state’s stability.

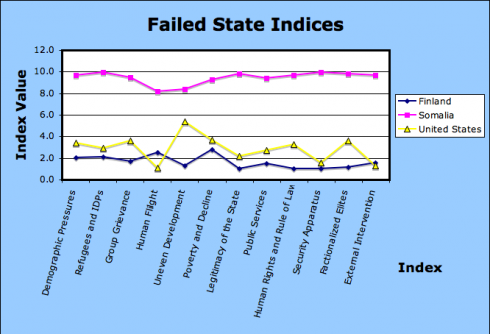
It’s also very nice that you can download their index data as a MS Excel spreadsheet, which you can let students analyze to answer their own research questions. For example, I was wondering what was the difference between the best, the worst and the USA, so I plotted this graph.

Comparing the best (Finland), worst (Somalia) and the USA using the Fund for Peace's Failed State Indicies.

The USA is much closer to Finland than Somalia, thank goodness, but should probably watch out for that Uneven Development (wealth inequality).

I think something like this would make a good experiential exercise for the science of geography.

Density, Stratification, and Phase Changes in a Jar

Which is denser? Which is least dense? Water, butter or honey? This might be a trick question.

When we bake bread we usually put all the wet ingredients –honey, water and butter– into a mason jar. If you do it carefully, the substances stratify: the honey forms a nice layer at the bottom as the water floats above it; and the butter, which has the lowest density, floats on top. You need to be careful about, since the honey can dissolve into the water if it is mixed, however, with a little careful pouring, this is an easy way to demonstrate density differences.

The butter, however, can be most interesting. If you put the butter in last, it will float on top of the water as it should. However, if you put it in first and then pour the honey on top of it, or even if you put it in second, after the honey is already in the jar, the butter will stick in the viscous honey and not float to the top.

What’s really neat, is what happens when you microwave the mixture with the butter stuck in the honey. The solid butter melts, and, because it’s less dense than the water above it, as well as because water and oils (like butter) don’t mix, little bubbles of butter will form and float upwards to the top. It’s like a lava-lamp only faster. And, in the end, the butter forms a liquid layer floating on the water.

National Academy’s Books are Now Free

How People Learn from the National Academies Press.

The National Academy Press has just made all of its publications free for downloading (as pdf’s). Of particular interest is the Education section which includes titles such as:

There are 20 books in the Education section, and while many of the books in the other sections are quite technical, there are some gems among the 4,000 available titles.