Based on my students’ statistics projects, I automated the method (using R) to calculate the z-score for all the states in the U.S. We used the John Hopkins daily data.
I put graphs for all of the states on the COVID: The U.S. States Compared webpage.
The R functions (test.R) assumes all of the data is in a folder (COVID-19-master/csse_covid_19_data/csse_covid_19_daily_reports_us/), and outputs the graphs to the folder ‘images/zscore/‘ which needs to exist.
covid_data <- function(infile, state="Missouri") {
filename <- paste(file_dir, infile, sep='')
mydata <- read.csv(filename)
pop <- read.csv('state_populations.txt')
mydata <- merge(mydata, pop)
mydata$ConfirmedPerCapita1000 <- mydata$Confirmed / mydata$Population *1000
summary(mydata$ConfirmedPerCapita1000)
stddev <- sd(mydata$ConfirmedPerCapita1000)
avg <- mean(mydata$ConfirmedPerCapita1000)
cpc1k <- mydata[mydata$Province_State == state,]$ConfirmedPerCapita1000
zscore <- (cpc1k - avg)/stddev
#print(infile, zscore)
return(zscore)
}
get_zScore_history <-function(state='Missouri') {
df <- data.frame(Date=as.Date(character()), zscore=numeric())
for (f in datafiles){
dateString <- as.Date(substring(f, 1, 10), format='%m-%d-%y')
zscore <- covid_data(f, state=state)
df[nrow(df) + 1,] = list(dateString, zscore)
}
df$day <- 1:nrow(df)
plot_zScore(df, state)
# LINEAR REGRESSIONS:
# http://r-statistics.co/Linear-Regression.html
lmod <- lm(day ~ zscore, df)
return(df)
}
plot_zScore <- function(df, state){
max_z <- max( abs(max(df$zscore)), abs(min(df$zscore)))
print(max_z)
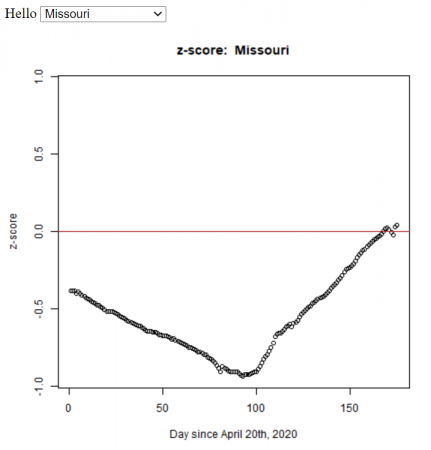
zplot <- plot(x=df$day, y=df$zscore, main=paste('z-score: ', state), xlab="Day since April 20th, 2020", ylab='z-score', ylim=c(-max_z,max_z))
abline(0,0, col='firebrick')
dev.copy(png, paste('images/zscore/', state, '-zscore.png', sep=''))
dev.off()
}
get_states <- function(){
lastfile <- datafiles[ length(datafiles) ]
filename <- paste(file_dir, lastfile, sep='')
mydata <- read.csv(filename)
pop <- read.csv('state_populations.txt')
mydata <- merge(mydata, pop)
return(mydata$Province_State)
}
graph_all_states <- function(){
states <- get_states()
for (state in states) {
get_zScore_history(state)
}
}
file_dir <- 'COVID-19-master/csse_covid_19_data/csse_covid_19_daily_reports_us/'
datafiles <- list.files(file_dir, pattern="*.csv")
print("To get the historical z-score data for a state run (for example):")
print(" > get_zScore_history('New York')" )
df = get_zScore_history()
You can run the code in test.R in the R console using the commands:
> source('test.R')which does Missouri by default, but to do other states use:
> get_zScore_history('New York')To get all the states use:
> graph_all_states()