An interesting application of statistical thinking used to estimate the number of tanks Germany was producing during WW2.
Category: Mathematics
What are Imaginary Numbers
The first 10 videos in this series explain where the idea of imaginary numbers come from, how the complex plane makes finding roots easier, and how imaginary numbers are needed for closure in algebra.
Polar Coordinates Animation
A couple quick programs (polarGraphs.py) to create animations of the drawing of functions in polar coordinates (for my pre-Calculus class).
It can export as a movie (mp4 as above). W can also transform functions (using: polarToCartesianGraph.py ) from rectangular to polar coordinates (and back: you can choose the settings).
A Note on using ChatGPT
This python program uses the matplotlib library, and, for the first time for me, I used ChatGPT to figure out the syntax for things like drawing arcs and arrows, and exporting animation files, instead of googling my questions. ChatGPT worked great, and significantly speeded up the process. It does make me wonder, however, that since these models are based off of what they’ve scraped from the internet, are they going to run create problems for themselves if people stop asking questions on places like stackoverflow and rely on AI instead. Although, this might just mean that the AI will tend to be just be a little bit behind the cutting edge and there will continue to be a need for question and answer forums.
The Center of a Triangle
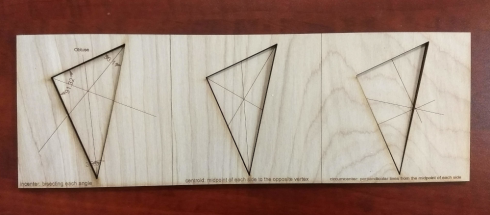
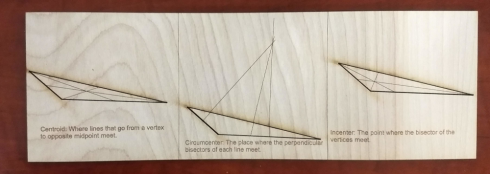
There are a few different ways of looking for the center of a triangle. My geometry students did the section in the textbook, then made cutouts on the laser.
They got some practice designing the triangles using a vector graphics program (Corel Draw). This did require an explanation of the difference between vector and raster images, since the majority of the class was unfamiliar with the concept. Raster images are made up of a grid of pixels, while vector images have instructions for where points go and where to draw lines. Vector images are great for diagrams like these because the files can be much smaller, the lines are more precise, and you can scale them up or down without losing any of that precision.
It turned out to be very useful to have them create the shapes and intersecting lines on the computer. It was pretty easy for them to precicely measure angles and find midpoints, so they could find the center points with much more accuracy than they could on just paper.
Having the final triangle cut-outs were also interesting. The centroid–the point of intersection of lines going from the vertices to their opposite side–is the center of gravity of the triangle, which means that, if you’re careful, you can use that point to balance the cut-out triangle on the tip of a pencil.
From Simple Equations to Complex Behavior
Another excellent video from Veritasium. Starts with the logistic equation and through a series of very clear examples gets to the relationship between growth rate (r) and equilibrium population. He does go into how this graph relates to the Mandelbrot set, but the rotating graphs are a little tricky to follow. However, the discussion of the practical applications of chaos theory (at 10:35) is really nice as well.
Note:
The logistic equation:
gives the new population (xₙ₊₁) for a given growth rate (r) and the old population (xₙ).
This makes for a fairly nice and easy programming assignment.
Calculating π
A very good explanation of how Newton applied calculus to come up with a much more efficient method of calculating pi (π). It starts with a nice illustration of the relationship between π and the area of a circle, moves explains the binomial theorem (quite nicely), and then shows how Newton generalized the binomial theorem to come up with an integral of a quarter of a unit circle. They don’t explain what a unit circle is, but that’s easy: it’s just a circle with a radius of 1.
What is Real? A Math Seminar (Prelude to Imaginary Numbers)
We had a really nice, thoughtful seminar discussion in Algebra II, with the simple question: What is real?
I did this as a lead into the topic of imaginary numbers ().
The distinction between tangible and intangible objects came up pretty early in the discussion. That morphed pretty quickly with the realization that there were things that you can’t touch, like ideas and thoughts that were real as well, despite being non-physical.
Then they considered some of the more edge-wise cases, such as, are dragons real. After all, they never really existed, but are parts or real myths. That thought lead to the idea that anything that was thinkable–anything you could think of–was real.
I jumped in, near the end, to insert the idea that maybe there were things that were not real–that were imaginary–but could be useful. And that’s how I set up my lesson on imaginary numbers.
Because even if you can’t calculate the square root of -1 (no number times itself will give a negative number).
You can give it a name.
And under certain circumstances:
You might find that imaginary numbers can combine to give you real numbers.
Which means we can do a whole lot of calculations that were impossible before, making imaginary numbers extremely useful.
Linearizing an Exponential Function: Radioactive Decay
Using this data for the decay of a radioisotope, find its half life.
t (s) | A (g) |
0 | 100 |
100 | 56.65706876 |
200 | 32.10023441 |
300 | 18.18705188 |
400 | 10.30425049 |
500 | 5.838086287 |
600 | 3.307688562 |
We can start with the equation for decay based on the half life:
where:
and linearize (make it so it can be plotted as a straight line) by using logarithms.
Take the log of each side (use base 2 because of the half life): Use the rules of logarithms to simplify: Finally rearrange a little:
Now, since the two variables in the last equation are A and t we can see the analogy between this equation and the equation of a straight line:
and, where:
So if we draw a graph with log₂(A) on the y-axis, and time (t) on the x axis, the slope of the line should be:
Which we can use to find the half life (λ).