UxPlay: Sharing iPad Screen on Linux (Ubuntu)

My setup for teaching online and in school students simultaneously requires me to mirror/share my iPad screen, which I’m using as a whiteboard, with a computer that’s doing video-conferencing for the online students and is hooked up to a projector for the in-class students.

I’ve been using X-Mirage on a Windows computer, but this week my Windows desktop started having trouble connecting to the internet in the middle of classes, and I’ve not been able to debug. Fortunately, I’d been setting up a donated laptop with Ubuntu Linux, mainly to use as a machine for programming, but a quick internet search lead me to Rodrigo Ribeiro’s UxPlay that allowed me to switch over to the Linux laptop for the last two days.

The installation instructions are straightforward, but I wanted to make a note to myself for future reference, because I did this on two different laptops and both times I had to run one of the commands I found in the comments.

So, to install run:

sudo apt-get install cmake
sudo apt-get install libssl-dev libavahi-compat-libdnssd-dev libgstreamer1.0-dev libgstreamer-plugins-base1.0-dev gstreamer1.0-libav
sudo apt-get install gstreamer1.0-vaapi

The last command was redundant on at least one of the computers, but didn’t seem to hurt.

You then download the UxPlay program from his webpage, and follow his instructions to unzip the file, cd into the directory, make a ./build folder, cd into that, and then run the commands:

cmake ..
make

At this point you may be able to run the program, but I was not able to connect my iPad until I ran:

sudo apt-get install gstreamer1.0-plugins-bad

Then I could launch the program (while still in that build directory) with:

./uxplay
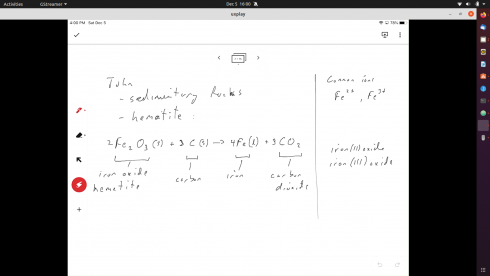
Screen mirrored using UxPlay showing my Jamboard notes that were written on the iPad.

Now, I just need to figure out the best way of streamlining the use of the program.

Update: I copied the “uxplay” executable into the “/usr/local/bin” folder so it’s now accessible from everywhere, and available to all users on the laptop.
How to make a Boxplot in R

Guest post by Grace Appell.

What is a Boxplot?

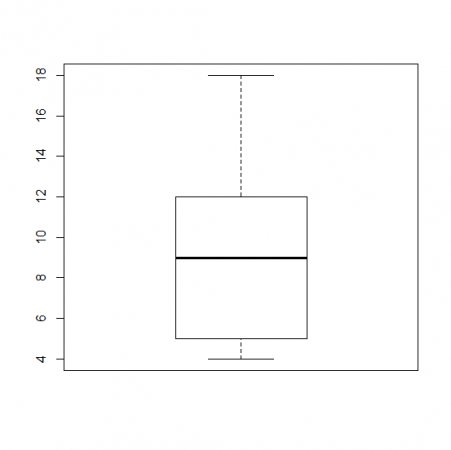
A box plot is a graph that helps you to analyze a set of data. It used to show the spread of the data. In it you use five data points: the minimum, the 1st quartile, the median, the 3rd quartile, and the maximum.
The minimum is the lowest point in your data set, and the maximum is the largest. The median is the number in the middle of the data set when you have the number lined up numerically.
For example if your data set was this:

 5, 6 ,11, 18, 12, 9, 4 

First you would put them in order lowest to highest.

4, 5, 6, 9, 11, 12, 18

Your median would be 9, because it is the middle number. The minimum would be 4, and the maximum would be 18.
The first quartile would be 5, the median of the numbers below 9, and the third quartile would be 12, the median of the numbers above 9.
So the data you would use in your boxplot would be

(4,5,9,12,18)

The boxplot would look like would look like this.

Example boxplot #1.
Example boxplot #1.

What is R?

R is a software program that is free to download that you can use for calculating statistics and creating graphics.
Here is their website: https://www.r-project.org/

Boxplots in R

In R you can create a boxplot by using this formula.

> Name of data set <- c(minimum, quartile 1, median, quartile 3, maximum)
> boxplot(Name of data set)

First you have to name your data set. In our project where we analyzed the number of times people repeated their Shakespeare lines that they performed, I used the name Macbeth. So the formula looked like this:

> Macbeth <- c(1,9,18,48,93)
> boxplot(Macbeth)

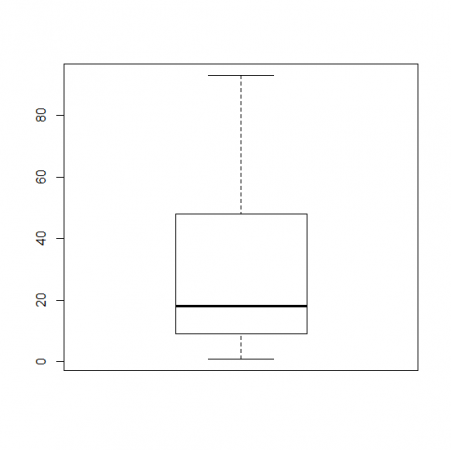
Using this data set, your box plot should look like this

Example boxplot #2.
Example boxplot #2.

Regression with Gnumeric

A test regression (linear equation) using Gnumeric.

Finally, I’ve found a spreadsheet application (Gnumeric) with a reliable Solver for doing regressions. And it’s free. The only tricky part is that there’s no native port for Macs; you have to use a command line package manager to install it (I used Fink).

Gnumeric, however, seems to be an excellent tool for data analysis.

Parabola Program

Animation showing the widening and shrinking of the parabola.

So I put together this interactive parabola program using VPython (code here) for students encountering these curves in Algebra.

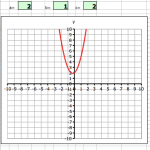
Simple Excel program to graph a parabola.

It’s a more interactive version of the Excel parabola program in that you can move the curve by dragging on some control points, rather than just having to enter the coefficients of the equation. The program is still in development, but it is at a useful stage right now, so I thought I’d make it available for anyone who wanted to try it.

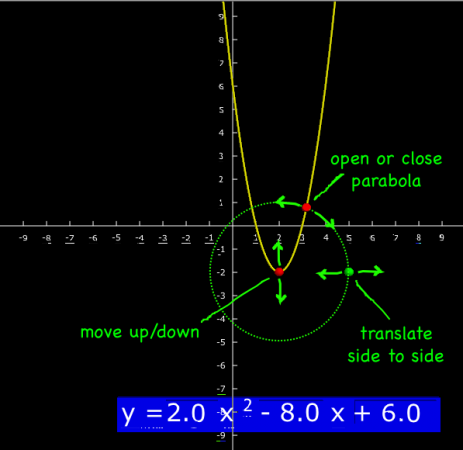
The program is fairly straightforward to use. You can move the curve (translate it) up and down, and expand or tighten the area within the parabola.

The program also displays the equation of the curve in standard form:
! y = ax^2 + bx + c

.

What the buttons do.

Next Steps

I’m also working making the standard equation editable by clicking on it and typing, and am considering showing the x-axis intercepts, which will give algebra students a nice, visual way to of checking their factoring.

References

Coffman, J., 2011 (accessed). Translating Parabolas. http://www.jcoffman.com/Algebra2/ch5_3.htm

Math Warehouse, 2011 (accessed). Equation of a Parabola
Standard Form and Vertex Form Equations, http://www.mathwarehouse.com/geometry/parabola/standard-and-vertex-form.php#

WolframAlpha.com, 2011 (accessed). http://www.wolframalpha.com/input/?i=a^2+x^4%2Bx^2-r^2%3D0

Considering LEGO Robotics

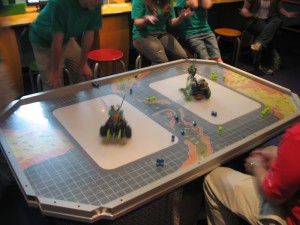
LEGO robots at the St. Louis Science Center.

There was a neat little conference today, organized by LEGO’s Education division. I’ve been trying to figure out a way to include robotics in my math and science classes, but since I haven’t had the time to delve into it, I was wondering if the LEGO Robotics sets would be an easy way to get started. It turns out that they have a lot of lesson plans and curricula available that are geared for kids all the way from elementary to high school, so I’m seriously considering giving it a try.

Pedagogically, there are a lot of good reasons to integrate robotics into our classes, particularly as the cornerstone of a project-based-learning curriculum.

  • The act of building robots increases engagement in learning. Just like assembling Ikea furniture makes people like it better, when students build something the accomplishment means more to them.
  • Working on projects builds grit, because no good project can succeed without some obstacles that need to be overcome. Success comes through perseverance. Good projects build character.
  • The process of building robots provides a sequence of potential “figure it out” moments because of the all steps that go into it, especially when students get ambitious about their projects. And students learn a whole lot more when they discover things on their own.
  • Projects don’t instill the same stress to perform as do tests. Students learn that learning is a process where you use your strengths and supplement your weaknesses to achieve a goal. They learn that their worth is more than the value of an exam.
  • Projects promote creativity, not kill it like a lot of traditional education.

In terms of the curriculum, Physics and Math applications are the most obvious: think about combining electronics and simple machines, and moving robots around the room for geometry. A number of the presenters, Matthew Collier and Don Mugan for example, advocate for using it across the curriculum. Mugan calls it transdisciplinary education, where the engineering project is central to all the subjects (in English class students do research and write reports about their projects).

I’ve always favored this type of learning (Somewhat in the Air is a great example), but one has to watch out to make sure that you’re covering all the required topics for a particular subject. Going into one thing in depth usually means you have to sacrifice, for the moment at least, some width. The more you can get free of the strictures of traditional schooling the better, because then you don’t have to make sure you hit all the topics on the physics curriculum in the seemingly short year that you officially teach physics.

The key rules about implementation that I gleaned from presentations and conversations with teachers who use the LEGO robotics are that:

  • Journaling is essential. Students are going to learn a lot more if they have to plan out what they want to do, and how to do it, in a journal instead of just using trial-and-error playing with the robots.
  • Promote peer-teaching. I advocate peer teaching every chance I get; teaching is the best way to learn something yourself.
  • 2 kids per kit. I heard this over and over again. There are ways of making larger groups work, but none are ideal.

A Plan of Action

So I’m going to try to start with the MINDSTORM educational kit, but this requires getting the standard programming software separately. One alternative would be to go with the retail kit, which is the same price and has the software (although I don’t know if anything else is missing).

I think, however, I’ll try to get the more advanced LabVIEW software that seems to be used usually for the high school projects that use the more sophisticated TETRIX parts but the same microcontroller brick as the MINDSTORM sets. LabVIEW might be a little trickier to learn, but it’s based on the program used by engineers on the job. Middle and high students should be able to handle it. But we’ll see.

Since LabVIEW is more powerful, it should ease the transition when I do upgrade to the TETRIX robots.

The one potential problem that came up, that actually affects both software packages, is that they work great for linear learners, but students with a more random access memory will likely have a harder time.

At any rate, not I have to find a MINDSTORM set to play with. Since I’m cheap I’ll start by asking around the school. Rumor has it that there was once a robotics club, so maybe someone has a set sitting around that I can burrow. We’ll see.

Sling: A VPython Model Demonstrating Centripetal Force and Conservation of Angular Momentum

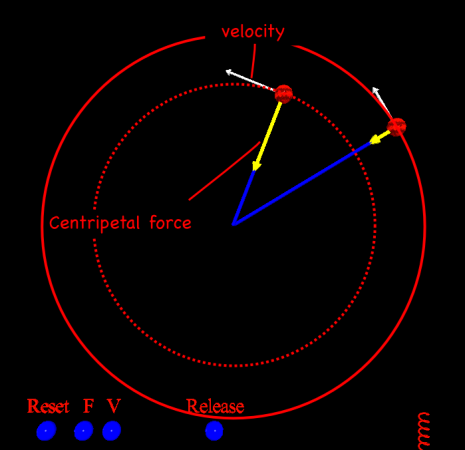
Animation captured from the sling.py Vpython model. The yellow arrow shows the centripetal force. The white arrow shows the velocity.

Sitting in a car that’s going around a sharp bend, its easy to feel like there’s a force pushing you against the side of the car. It’s called the centrifugal force, and while it’s real to you as you rotate with the car, if you look at things from the outside (from a frame of reference that’s not rotating) there’s really no force pushing you outward. The only force is the one keeping you in the car; the force of the side of the car on you. This is the centripetal force. Given all the potential for confusion, I created this little VPython model that mimics a sling.

Centripetal Force

In the model, you launch a ball and it goes off in a straight line. That’s inertia. An object will move in a straight line unless there’s some other force acting on it. When the ball hits the string, it catches and the string starts to pull on the ball, taking it away from its straight line trajectory. The force that pulls the ball away from its original straight path is the centripetal force.

Image from Stern (2004): (23a) Frames of Reference: The Centrifugal Force

Conservation of Angular Momentum

The ball rotating on the sling has an angular momentum (L) that’s equal to the velocity (v) times its mass (m) times its radius (r) away from the center.

L = mvr            , angular momentum

Now, angular momentum is conserved, which means that if you shorten the string, reducing the radius, something else must increase to compensate. Since the mass can’t change, the velocity has to, and the ball speeds up.

The ball on the string with the shorter radius has the higher velocity (moves faster). It also has a higher centripetal force. The ball for shortening the radius is not shown in this figure.

I’ve put in a little ball at the end of the string that you can pull on to shorten the radius.

Tangential Velocity

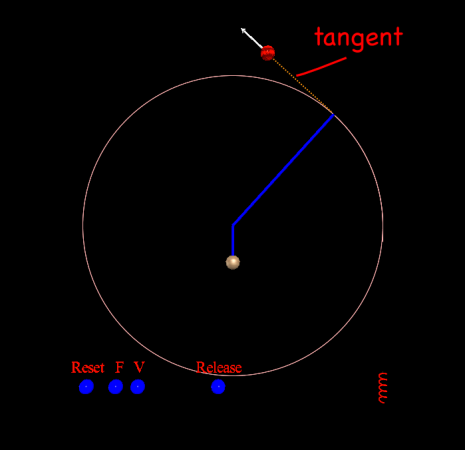
Once the ball is attached to the string, the centripetal force will keep it moving in a circle. If you release the ball then it will fly off in a straight line in whatever direction it was going when you released it. With no forces acting on the ball, inertia says the ball will move in a straight line.

The ball, when released from the string, flies off in a tangent.

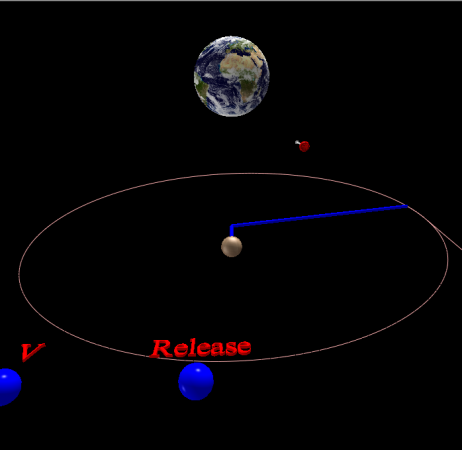
To better illustrate the ball’s motion off a tangent, I put in a target to aim for. It’s off the screen for the normal model view, but if you rotate the scene to look due north you’ll see it.

Algebra and Programming with VPython

Computer programming is the place where algebra comes to life. Students seem to get really excited when they write even the simplest instructions and see the output on the screen. I’m not sure exactly why this is the case, but I suspect it has something to do with being able to see the transition from abstract programming instructions to “concrete” results.

So I’ve decided to supplement my Algebra classes with an introduction to programming. I’m using the Python programming language, or, more specifically, the VPython variant of the language.

Why VPython? Because it’s free, it’s an easy-to-use high-level language, and it’s designed for 3d output, which seems to be somewhat popular these days. The oohs and aahs of seeing the computer print the result of a+b turn into wows when they create their first box. I’ve used the language quite a bit myself, and there are a lot of other interesting applications available if you search the web.

VPython was created to help with undergraduate physics classes, but since it was made to be usable by non-science majors, it’s really easy for middle and high school students to pick up. In fact, NCSU also has a distance education course for high school physics teachers. They also have some instructional videos available on YouTube that provide a basic introduction.

Image from a game created by middle school student Ryan W.

I use VPython models for demonstrations in my science classes, I’ve had middle school students use it for science projects, and I’ve just started my middle school algebra/pre-algebra students learning it as a programming language and they’re doing very well so far.

What I hope to document here is the series of lessons I’m putting together to tie, primarily, into my middle school algebra class, but should be useful as a general introduction to programming using VPython.

Getting VPython

You’ll need to install Python and VPython on your system. They can be directly downloaded from the VPython website’s download page for Windows, Macintosh or LINUX.

Running a Python program.

Once they’re installed, you’ll have the IDLE (or VIDLE) program somewhere on your system; a short-cut is usually put on the desktop of your Windows system. Run (double-click) this program and the VPython programming editor will pop up any you’re ready to go. You can test it by typing in something simple like:

a = 1
b = 2
c = a + b
print c

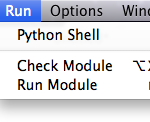
Then you run the program by going through the Run–>Run Module in the menu bar.

Which should cause a new window to pop up with:

Python 2.7.1 (r271:86882M, Nov 30 2010, 09:39:13) 
[GCC 4.0.1 (Apple Inc. build 5494)] on darwin
Type "copyright", "credits" or "license()" for more information.
>>> ================================ RESTART ================================
>>> 
3
>>> 

Even better might be to test the 3d rendering, which you can do with the following program:

from visual import *

box()

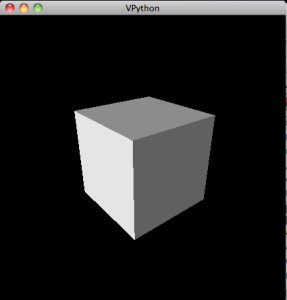
which creates the following exciting image:

A box created with VPython. It looks much more interesting if you rotate it to see it in perspective.

To rotate the view, hold down and drag the right mouse button. To zoom in or out, hold down the right and left buttons together and drag in and out.

A rotated, zoomed-out view of a box.

Lessons

Lesson 1: Variables, Basic Operations, Real and Integer Numbers and the First Box.

Lesson 2: Creating a graphical calculator: Coordinates, lists, loops and arrays: A Study in Linear Equations

Mindmapping Online with Mind42

Excerpt from my pre-Algebra/Algebra mindmap created on Mind42.com

I was trying to figure out how I could create a graphic organizer/mindmap to outline my math class that my students could access online. Even better would be if they could also edit the map online. That way I could set up the outline of my lesson notes and they could fill in definitions for vocabulary words. Mind42 (pronounced mind for two) allows just that. It’s free to use and allows you to link to or embed your mindmaps (e.g. pre-Algebra/Algebra) into other websites:

It’s almost perfect, all it needs is for you to be able to save the state of the map, with certain branches collapsed for example, or with a set zoom level. Right now the best way to explore the above map is to collapse all the nodes (use the second button on the lower left) and gradually expand them out as you go through.

I do think the style of the nodes and lines on the maps are elegant and make it easy to read. It’s also really easy to create the maps.

Apart from putting your maps to other websites, you can also print them out as pdf’s or images (png), or you can save the map itself in a format that other mindmapping software, like Freemind, can use.

I really like this website, and as soon as they add the ability to save zoom levels and collapsed nodes I’m going to try using it for my classes.