Fortune Teller


Eve’s Fortune Teller

The student project that I keep revisiting the most is the Fortune Teller webpage created a couple years ago by former student Eve J.

You get a randomly generated fortune, and Eve built in enough combinations that I still see unique fortunes two years later.

I think what I like the most about it is how well it captures Eve’s “voice”. The style of the sentences and the little twists that pop up here and there. I can’t help reading this in her voice.

Eve is off in college right now, and gave me permission to post about the project, and to adapt the code as necessary, as long as I keep her informed (Hi Eve!).

I’ve ported the core of her program from JavaScript to PHP so you can now just get just the fortune telling text.


Eve’s Fortune Teller

https://soriki.com/eve/fortune/fortune.php?name=Doc

I’ve also, sort of, memefied the fortunes but putting the text over a background image, which is what you see at the top of the post.

https://soriki.com/eve/fortune-m/meme-fortune.html?name=Doc

As an experiment, I now have a version that makes the image as an svg:

I have another student now who’s interested in making a smart mirror, and this will make it easier to include fortunes into that project.

I’ve also posted the project on Github: https://github.com/lurbano/fortune

Environments for Teaching Python in Middle and High School

I’ve been using python as the primary programming language for all of my classes, from middle to high school. However, with a variety of different machines and operating systems–macs, PC’s, OSX, Windows, ChromeOS–it has been bit of a pain getting everyone up and running and on the same page. It has been especially problematic because I like to use NumPy and, especially, the VPython module because of its nice, easy 3d visualizations.

I’ve tried Anaconda, which works great on some machines but not so much on others. One student with a Mac had to restart the kernel every time he ran a program with vpython, while others had trouble getting it to work properly at all. I do like the way it allows you to put everything into a single Jupyter Notebook, which works nicely for teaching-length programming assignments, but becomes cumbersome for longer projects. Joel Grus goes into detail about why he does not like Notebooks for teaching; much of which I agree with. I do like the Spyder IDE a lot, but I’ve run into some computers that have problems with it (constant crashes).

So, I’ve been using Glowscript a lot with the lower grades. It’s online, so you only need a browser, and its made for vpython, so you can do a lot of the numerical work with it. However, because it’s online you can’t, understandably, get it to write output files to your computer–you have to copy and paste from its output. I’m also not sure how to import user-created modules, which further limits its utility for higher-level classes.

I’ve recently run into repl.it, and I’m having a student try it out in my Numerical Methods class. It looks quite promising as it seems to be able to manage files well and we’ve tried some basic numerical programs using numpy and matplotlib. However, I’ve not got it running vPython yet (although it’s come close).

(repl.it update): One of our other teachers has been trying repl.it with the middle school class and really likes it.

I’ve also recently discovered MakeCode. I’m looking into it for the lower grades, down to 6th grade or even earlier, because it lets you write programs for Minecraft, which is very popular with a remarkably broad age group. It lets you work in blocks, python, or JavaScript. From my poking around, the first couple of things it teaches you to do in Minecraft are write statements (to generate a chicken) and the loops (to generate a lot of chickens). I’ve asked one of my 9th grade, Minecraft players to investigate, so I should have some results to report soon.

At the moment, for my most advanced class, we’re taking a whatever-works approach. We’re learning about finite differences and using matplotlib to graph the output. I have one student, mentioned above, using repl.it, and another one using Jupyter Notebook on a Mac. A different Mac user is invoking IDLE from the command line because they prefer the IDLE IDE, but couldn’t get numpy to install properly with the python 3.9 version they’d installed earlier–the command-line IDLE actually goes to their Anaconda installation. I have one student, on a Windows machine, for whom everything just works and are using their regular IDLE installation. We spent the entire class period getting everyone up and running with something, but at least now everyone has at least one environment they can use. I’m curious to see what the kids who have multiple options are going to go with.

Comparing Covid Cases of US States

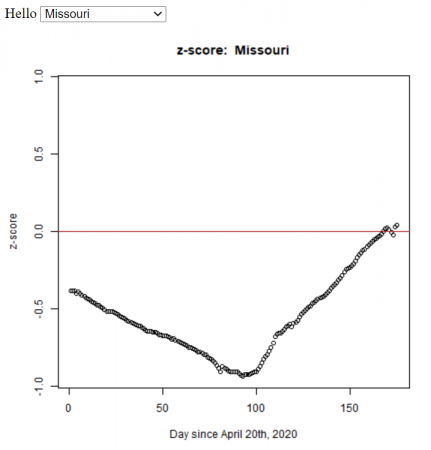
Missouri’s confirmed cases (z-score) compared to the other U.S. states from April 20th to October 3rd, 2020. The z-score is a measure of how far you are away from the average. In this case, a negative z-score is good because it indicates that you’re below the average number of cases (per 1000 people). For all the states.

Based on my students’ statistics projects, I automated the method (using R) to calculate the z-score for all the states in the U.S. We used the John Hopkins daily data.

I put graphs for all of the states on the COVID: The U.S. States Compared webpage.

The R functions (test.R) assumes all of the data is in a folder (COVID-19-master/csse_covid_19_data/csse_covid_19_daily_reports_us/), and outputs the graphs to the folder ‘images/zscore/‘ which needs to exist.

covid_data <- function(infile, state="Missouri") {
    filename <- paste(file_dir, infile, sep='')
    mydata <- read.csv(filename)
    pop <- read.csv('state_populations.txt')
    mydata <- merge(mydata, pop)
    mydata$ConfirmedPerCapita1000 <- mydata$Confirmed / mydata$Population *1000
    summary(mydata$ConfirmedPerCapita1000)
    stddev <- sd(mydata$ConfirmedPerCapita1000)
    avg <- mean(mydata$ConfirmedPerCapita1000)
    cpc1k <- mydata[mydata$Province_State == state,]$ConfirmedPerCapita1000
    zscore <- (cpc1k - avg)/stddev
    #print(infile, zscore)
    return(zscore)
}


get_zScore_history <-function(state='Missouri') {
  df <- data.frame(Date=as.Date(character()), zscore=numeric())
  for (f in datafiles){
    dateString <- as.Date(substring(f, 1, 10), format='%m-%d-%y')
    zscore <- covid_data(f, state=state)
    df[nrow(df) + 1,] = list(dateString, zscore)
  }
  df$day <- 1:nrow(df)

  plot_zScore(df, state)


  # LINEAR REGRESSIONS:
  # http://r-statistics.co/Linear-Regression.html
  lmod <- lm(day ~ zscore, df)
  return(df)
}

plot_zScore <- function(df, state){
  max_z <- max( abs(max(df$zscore)), abs(min(df$zscore)))
  print(max_z)


  zplot <- plot(x=df$day, y=df$zscore, main=paste('z-score: ', state), xlab="Day since April 20th, 2020", ylab='z-score', ylim=c(-max_z,max_z))
  abline(0,0, col='firebrick')
  dev.copy(png, paste('images/zscore/', state, '-zscore.png', sep=''))
  dev.off()
}

get_states <- function(){
  lastfile <- datafiles[ length(datafiles) ]
  filename <- paste(file_dir, lastfile, sep='')
  mydata <- read.csv(filename)
  pop <- read.csv('state_populations.txt')
  mydata <- merge(mydata, pop)
  return(mydata$Province_State)
}

graph_all_states <- function(){
  states <- get_states()
  for (state in states) {
    get_zScore_history(state)
  }
}

file_dir <- 'COVID-19-master/csse_covid_19_data/csse_covid_19_daily_reports_us/'
datafiles <- list.files(file_dir, pattern="*.csv")

print("To get the historical z-score data for a state run (for example):")
print(" > get_zScore_history('New York')" )

df = get_zScore_history()

You can run the code in test.R in the R console using the commands:

> source('test.R')

which does Missouri by default, but to do other states use:

> get_zScore_history('New York')

To get all the states use:

> graph_all_states()

Logic Gates Programming Assignment

To follow up on the introduction to Logic Gates post, this assignment is intended to help students practice using functions and logic statements.

  1. Write a set of function that act as logic gates. That is, they take in one or two inputs, and gives a single true or false output based on the truth tables. Write functions for all 8 logic gates in the link. An example python program with a function for an AND gate (the function is named myAND) is given in the glowscript link below.
  2. Write a function that uses these functions to simulate an half-adder circuit. Create a truth table for the input and output.
  3. Write a function that uses the gate functions to simulate a full-adder circuit. Create a truth table for the input and output.

Here’s a program with an example function for an AND gate (called myAND), and a simple program to test it.

The half-adder circuit is shown below.

Half Adder circuit.

The full adder circuit:

Full adder circuit by en:User:Cburnett on wikimedia.org

Logic Gates

Truth tables by Seth Abels.

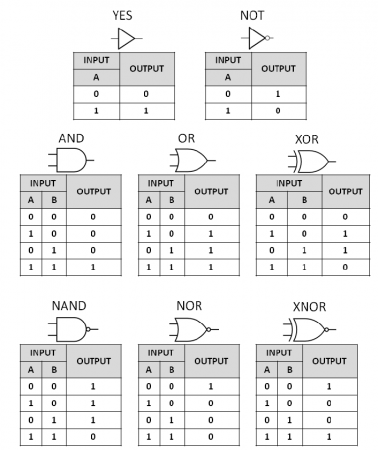
Logic gates are the building blocks of computers. The gates in the figure above take one or two inputs (A and B) and give different results based on the type of gate. Note that the last row of gates are just the opposite of the gates in the row above (NAND gives the opposite output to AND).

As an example, two gates, an AND and an XOR, can be used to make a half-adder circuit

Half adder circuit

By feeding in the four different combinations of inputs for A and B ([0, 0], [1, 0], [0, 1], and [1, 1]) you can see how these two gates add the two numbers in binary.

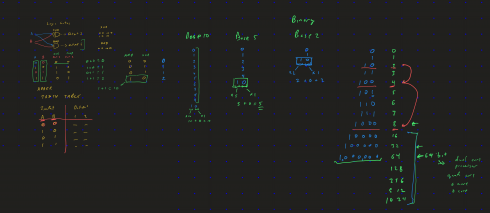
Creating a truth table for the half adder.

I find this to be an excellent introduction to how computers work and why they’re in binary.

Introduction to Pi’s (Raspberry Pi)

The family of Raspberry Pi’s are just really small computers. You can plug a monitor, keyboard, and mouse into one and it will not look too different from your desktop. They are small and cheap, but what makes them really useful is that they have little slots (called GPIO’s) that you can stick wires into that allow you to build circuits that can get information from sensors and control devices like LED lights or motors.

This is a quick introduction about how to set one up. You’ll find lots of great tutorials on the internet. This one is specific to my needs: it’s an introduction to the Pi’s for students who are new to them; I’m setting it up with a web server so we can control the devices through a webpage; and I’m setting it up so you can control the Pi “headlessly”, which means you don’t need the keyboard, mouse, etc..

Installing the Operating System

Downloading the OS

Download: The operating system files can be downloaded from the Raspberry Pi website. We’re going to use the Raspbian Desktop version with the recommended software.

Your typical computer has a built in hard drive that stores the data you save, the programs/apps you install, and the operating system (OS) that runs it all. When you start the computer the first thing it does is read the files that make up the operating system from the hard drive and set them up in the active, processing memory (RAM). Then when you interact with the computer (type on the keyboard, click the mouse etc.) you’re interacting with the operating system: you tell the operating system what to do, like start up a web browser (Firefox, Chrome, Safari, Explorer, Opera etc.), and it does it. And when your apps want to do something, like save a file, they have to ask the operating system to do it.

On the Raspberry Pi the data for the operating system is not stored on a built in hard drive, but on an SD card (or microSD), which means that you’re going to have to install the operating system yourself to get your Pi running. You can find the operating system at the Raspberry Pi website’s download page.

Installing

As of this writing, I’ve been using balenaEtcher to install the operating system on the SD Card.

balenaEtcher is free and pretty easy to use. Hopefully, your computer has an SD card port, if not you’re going to have to find an adapter. Just plug your SD card into your computer and run Etcher, it will ask you to:

  • Select Image: Which is the Raspbian file you downloaded
  • Select Drive: Which should default to the SD card you plugged in (check the size of the drive to make sure)
  • Flash: Which writes the Operating System files to the SD card, making sure everything is in the right place.

You may see some warnings pop up about Unrecognized Files Systems or similar. You can just close those windows.

When the flashing is done, don’t take the SD card out of your computer (or put it back in if you have) just quite yet. We’re going to set it up so the Pi can automatically connect to the WiFi, which will make it easier to talk to.

Setting Up WiFi

You’re going to have to edit some files on the SD card to give the Pi the information about the WiFi situation so that it can automatically connect. This is most useful if you’re not going to plug in a keyboard and monitor and just want to control the Pi from your computer (more on how to do this later). If you do want to go the keyboard and mouse route, you can just plug the SD card into the Pi, power it up, and set up the WiFi like you would normally do on your laptop.

To edit the files I use Atom on Windows or TextEdit which is built in on Mac. These programs should allow you to easily save files as plain text, without any of the fancy styling that will create errors when the Pi operating system tries to get the information from the files.

WiFi

Create a new file called: “wpa_supplicant.conf” (based on these notes) containing:

ctrl_interface=/var/run/wpa_supplicant GROUP=netdev
update_config=1

network={
 ssid="networkID"
 psk="password"
}

But you have to change:

  • networkID to the name of the WiFi network you’re trying to connect to
  • password to the password for the network

If you need to connect to multiple networks (home and school for example) you can add another network command on a new line after the first one:


network={
 ssid="otherNetwork"
 psk="otherPassword"
}

Save this file to the boot directory of the SD card.

ssh

ssh allows you to remotely connect to your Pi’s operating system. This means that you can use your laptop to control the Pi (however you’ll be using command line commands).

Create an empty file named “ssh” and save it to the boot directory of your SD card.

USB connection

You should be able to find your Pi on the network (I use an app on my phone called Fing) and ssh in. However, to do most of the setup, especially if the Pi has trouble connecting to the WiFi (or you can’t find it on the network), you’ll probably want to set up your pi so you can plug it into your computer’s USB port and control it from the computer. Based on the notes from Adafruit, do this:

Open the file “config.txt” which is in the SD card’s boot directory, and add this as the last line in the file:

dtoverlay=dwc2

Save the file then:

Open the file “cmdline.txt”, find the word “rootwait” and, after it, insert the phrase:

 modules-load=dwc2,g_ether

You should end up with something that looks like “…=yes rootwait modules-load=dwc2,g_ether quiet…”:

Connecting to your Pi

To talk to your Pi’s Operating System you should be able to connect your Pi’s USB port to your computer’s or connect over WiFi. Either way you’ll need to use an ‘ssh’ program.

  • Windows: I use putty. Install the program and run it. Then you’ll need to enter:
    • Host Name: raspberrypi.local
    • Password: raspberry
  • Mac: I use the built-in Terminal (In your Applications->Utilities folder). Type in the command (don’t type in the “>”):
    • > ssh raspberrypi.local
    • Use the password: raspberry

If you go the WiFi route, you’ll need to find your Pi’s IP address and use that as the Host Name.

Update and Upgrade

Once you’re ssh’d in, and are connected the internet, you can update and upgrade the operating system. Type in the commands (without the “>”).

> sudo apt-get update
> sudo apt-get upgrade

The “sudo” means you’re giving yourself permission to run commands that could potentially mess up your system. The program you’re running is called “apt-get” which connects to the internet repositories with the latest updates and upgrades to your operating system and programs, and then downloads and installs them. The options “update” and “upgrade” specifically tells the “apt-get” program what you want it to do. Downloading and upgrading may take a while.

Enable Interfaces

You’ll also want to check that the interfaces to the GPIO pins are enabled, so you can build circuits and control them. Notes on this are here.

First check that your tools are installed and updated with the commands:

> sudo pip3 install --upgrade setuptools
> sudo apt-get install -y python-smbus
> sudo apt-get install -y i2c-tools

Then Activate the Interfaces. You’ll run the command “raspi-config” and then use your keyboard to tab through the windows to activate the I2C and SPI interfaces. These are just two different ways for the Pi to talk to the devices you plug into it.

> sudo raspi-config
---- Interfacing Options
-------- I2C
------------ Yes
---- Interfacing Options
-------- SPI
------------ Yes

To get this all up an running you need to reboot the Pi:

> sudo reboot now

For the OLED displays

To control the little OLED displays we have, install the adafruit-blinka, and OLED libraries:

> sudo pip3 install adafruit-blinka
> sudo pip3 install adafruit-circuitpython-ssd1306

Tornado Server

The tornado server allows us to create webpages on the Pi that we can connect to over WiFi that can be used to control devices connected to the Pi. Install tornado using:

> sudo pip3 install tornado

Now restart everything and we can get to work.

> sudo reboot now
Programming Lesson: Distance Between Two Points

Assignment: Write a program to find the distance between two points.

To find the distance (c) between two points (x1, y1) and (x2, y2) you use the equation:

  c = \sqrt{a^2 + b^2}

where a and b are:

  a = x_2 - x_1
  b = y_2 - y_1

So, let’s find the distance between the points (1,7) and (5, 2) using python:

# define inputs
x1 = 1
y1 = 7
x2 = 5
y2 = 2

# calculate distance
a = x2 - x1
b = y2 - y1

c = (a**2 + b**2)**0.5   

# output the result
print("Distance between two points.")
print("Point 1:", x1, y1)
print("Point 2:", x2, y2)
print("Distance:", c)

The result should look like:

Distance between two points.
Point 1: 1 7
Point 2: 5 2
Distance: 6.40312